Jun-2026
Sales
Trend
6-Month
Product Count
SKUs
Avg Price
YoY Sales Change
YoY Price Change
Market Insights Snapshot
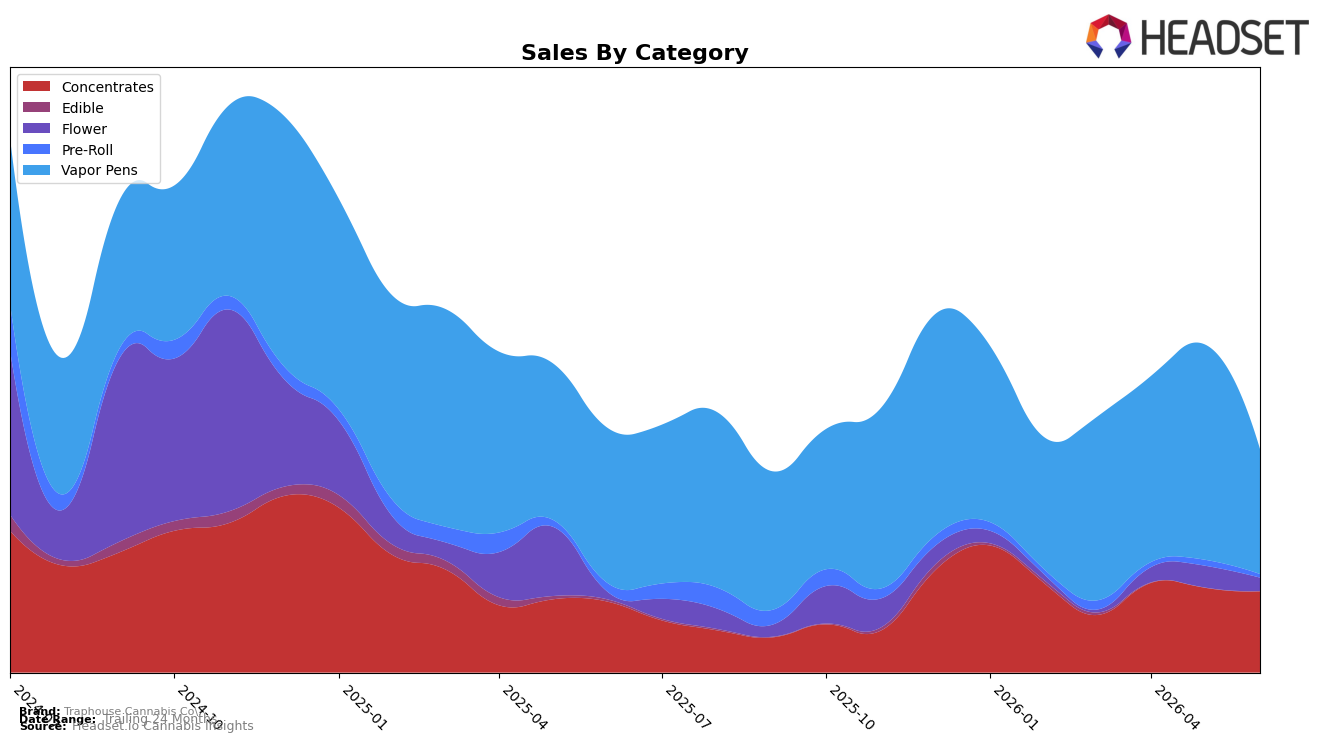
In June 2026, Vapor Pens still anchor Traphouse Cannabis Co.’s mix at 55.58% share, but category sales fell 19.40% year over year and 41.88% month over month, while Concentrates climbed 14.47% YoY and dipped only 4.43% MoM to 36.14% share. Flower expanded 79.26% YoY but slid 38.28% MoM to 6.08% share, and Pre-Roll contracted 56.41% YoY and 36.72% MoM to 1.78% share as Edible, though just 0.42% share, jumped 45.75% MoM despite a 64.22% YoY decline. With Vapor Pens ranked 24th in Michigan and the average brand price up 1.86% YoY to $8.48, the pattern implies a shift away from a single-category dependency toward a more balanced portfolio, but with near-term volatility concentrated in month-over-month declines for larger segments.
The mix shift—Vapor Pens down 41.88% MoM while Concentrates slipped only 4.43% and Flower fell 38.28%—signals that Traphouse Cannabis Co.’s competitive footing in Michigan Vapor Pens (rank 24) is under pressure, and resilience is more likely to come from Concentrates and selective moves in Edible after a 45.75% MoM rise. Given brand sales down 8.40% YoY and a 24‑month decline of 67.13%, reallocating emphasis toward Concentrates’ 36.14% share and protecting price architecture around an average $8.48 suggests positioning as a value-led, multi-category player rather than a Vapor Pen specialist, with the thesis that marginal gains across secondary categories can offset rank and share headwinds in the primary category.
Competitive Landscape
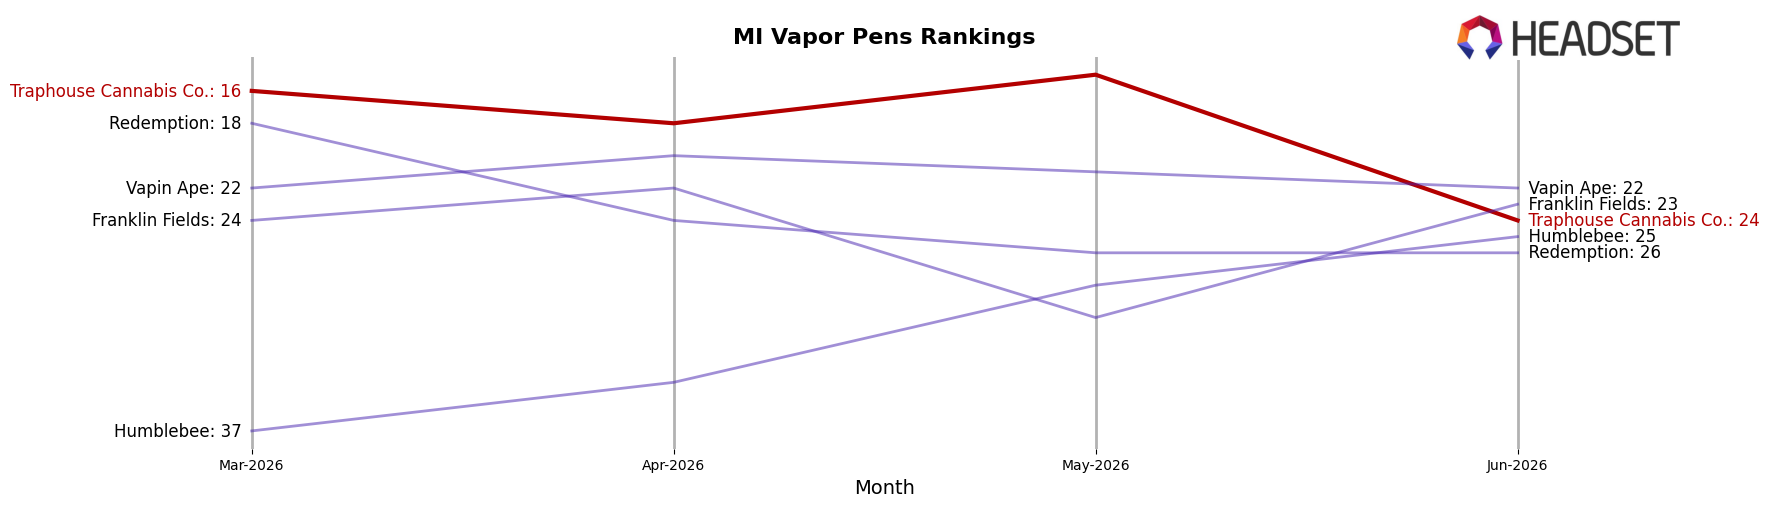
Traphouse Cannabis Co. sits at rank #24 in MI Vapor Pens in June 2026, down 8 positions year over year from #16, and 8 positions lower than its March 2026 placement at #16; the brand is also 12 ranks below its peak at #12 from December 2024. Meanwhile, MKX Oil Company climbed from #3 to #1 with 68.3% year-over-year sales growth, and Society C surged from #29 to #4 alongside a 756.2% year-over-year sales increase, indicating competitive share is consolidating upward while mid-pack incumbents like Traphouse Cannabis Co. lose rank. The pattern implies Traphouse Cannabis Co.’s slide from #16 to #24 amid top-tier ascents requires either a pricing or assortment reset to re-enter the top 20.
Notable Products
Blue Razz Distillate Cartridge (1g) posted the steepest decline in June 2026 at -23.3% MoM while sliding to rank 8, and Sour Tangie Distillate Cartridge (1g) fell -18.1% MoM at rank 6, signaling fragility in mid-tier Vapor Pens. In contrast, Sweet Island Punch Distillate Cartridge (1g) rose +15.6% MoM to hold rank 1 with $38,147, as Strawberry Shortcake Distillate Cartridge (1g) dropped -10.5% at rank 2, implying share is consolidating at the top. With six of the top ten SKUs in Vapor Pens and none above +20% MoM, the category mix is tilting toward a single leader rather than broad-based growth. The pattern implies Traphouse Cannabis Co. is leaning into a flagship pen strategy while allowing weaker Vapor Pen SKUs to cycle down, creating room for selective Concentrates entries to stabilize ranks 5, 9, and 10.
Top Selling Cannabis Brands
Data for this report comes from real-time sales reporting by participating cannabis retailers via their point-of-sale systems, which are linked up with Headset’s business intelligence software. Headset’s data is very reliable, as it comes digitally direct from our partner retailers. However, the potential does exist for misreporting in the instance of duplicates, incorrectly classified products, inaccurate entry of products into point-of-sale systems, or even simple human error at the point of purchase. Thus, there is a slight margin of error to consider. Brands listed on this page are ranked in the top twenty within the market and product category by total retail sales volume.

