.svg)
Aug-2026
Sales
Trend
6-Month
Product Count
SKUs
Avg Price
YoY Sales Change
YoY Price Change


Market Insights Snapshot
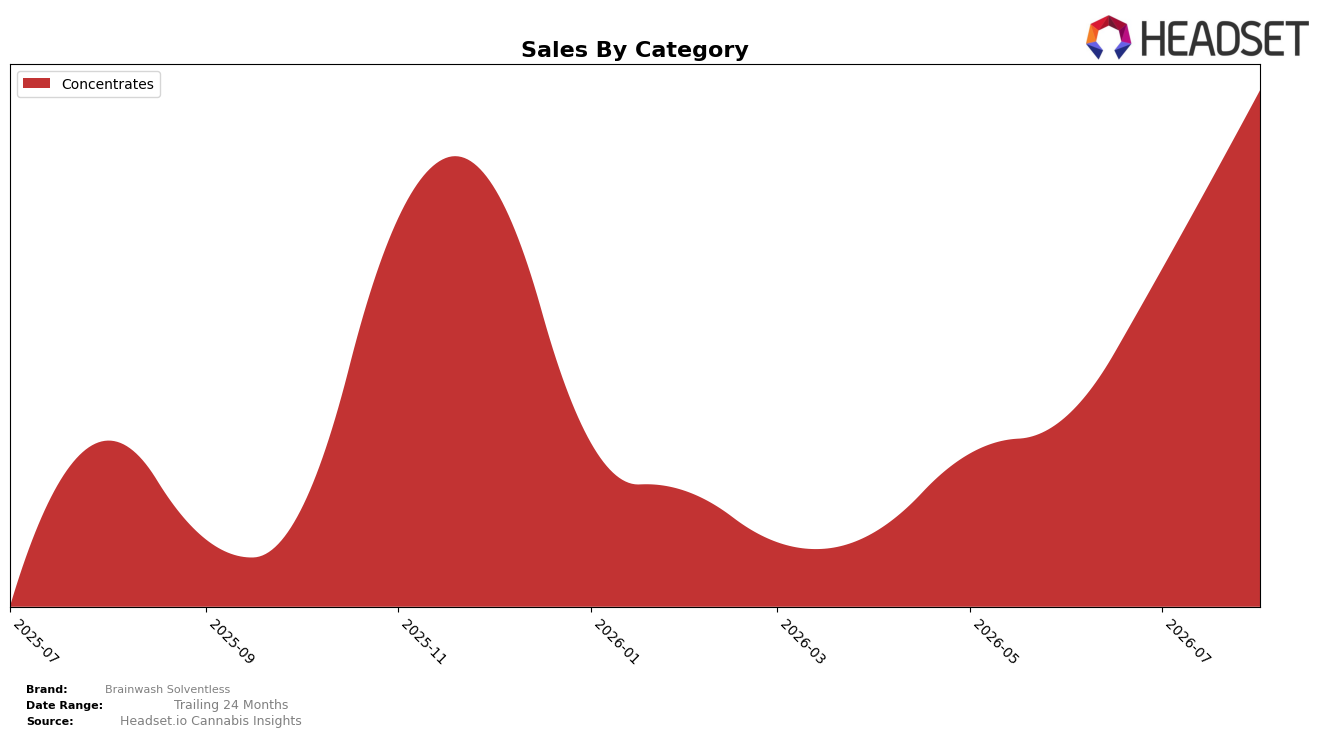
In August 2026, Brainwash Solventless operated as a single-category brand, with Concentrates representing 100.0% of sales share and averaging $22.54 per unit. Within that monopoly mix, Concentrates expanded 163.5% year over year while also rising 46.2% month over month, and the average price increased 6.9% YoY alongside a double-digit MoM volume lift implied by the share stability. With Concentrates holding the entire portfolio and Michigan as the top state context, the concentration raises both exposure and agility: the August 2026 pattern implies Brainwash Solventless is trading higher velocity for a modest price step-up within one category, amplifying category risk even as it accelerates.
Positioning-wise, the single-category footprint in Concentrates paired with a rank of 39 in Michigan suggests a niche slot that can move quickly on pricing and velocity; the 46.2% MoM sales gain alongside a 6.9% YoY price increase points to demand that is not purely discount-driven. Given the 163.5% YoY surge concentrated entirely in Concentrates and a current average price of $22.54, the brand is leaning into depth over breadth, which implies defensibility via product specialization but also caps cross-category insulation if Concentrates cyclically soften.
Competitive Landscape
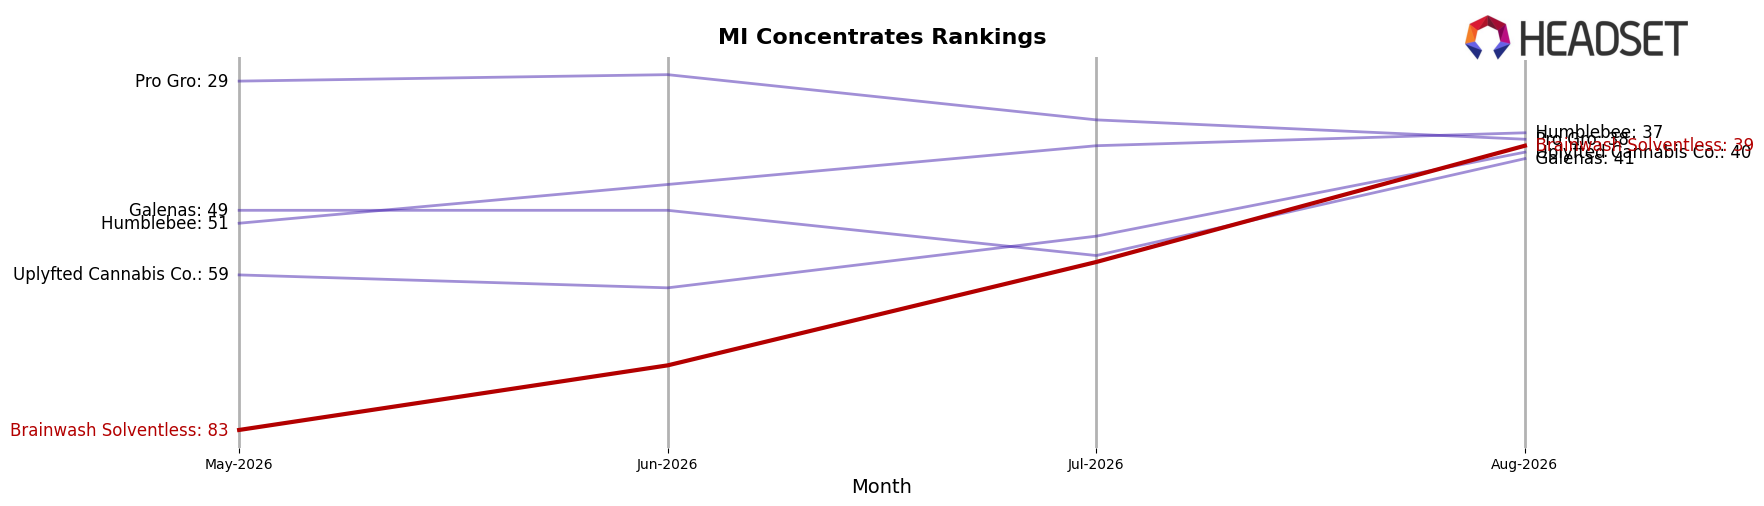
Brainwash Solventless sits at rank #39 in MI Concentrates in August 2026, improving 43 positions from #82 year over year and climbing 44 places from #83 three months ago, while also marking its peak at #39 in August 2026; by contrast, The Limit held steady at #1 year over year, and Uniq Pressure surged from #126 to #3 alongside a 3,686.2% sales YoY change. This mix—large upward rank shifts from the low tiers and stability at the top—implies Brainwash Solventless is benefiting from mid-pack churn and timing into peak visibility, but must convert the #39 peak into sustained gains against incumbents entrenched at #1 and fast risers reaching the top 5.
Notable Products
Biscotti Pippen Live Rosin (1g) posted the largest month-over-month surge at 288.0% to rank 2, while Stankonya Live Rosin (1g) fell 37.7% to rank 3, indicating a sharp reallocation of demand toward a newer hero SKU. Pink Guava Live Rosin (1g) rose 79.6% to hold rank 1 as Sugar Shack Live Rosin (1g) declined 12.6% at rank 5, and three SKUs—Strawberry Pie Live Hash Rosin (1g) at 192.9%, Rainbow Guava Live Hash Rosin (1g) at 131.8%, and Strawberry Pie Live Rosin (1g) at 131.7%—delivered triple-digit gains that crowded the top 10. With all top-10 items in Concentrates and eight of ten carrying the Live Rosin or Live Hash Rosin format, the portfolio is consolidating around terp-rich rosin variants and pushing volume into a tight set of fast-climbing flavors. The pattern implies Brainwash Solventless is prioritizing high-velocity rosin drops over breadth, concentrating marketing and supply on a few breakout strains to capture rank share in August 2026.
Top Selling Cannabis Brands






Data for this report comes from real-time sales reporting by participating cannabis retailers via their point-of-sale systems, which are linked up with Headset’s business intelligence software. Headset’s data is very reliable, as it comes digitally direct from our partner retailers. However, the potential does exist for misreporting in the instance of duplicates, incorrectly classified products, inaccurate entry of products into point-of-sale systems, or even simple human error at the point of purchase. Thus, there is a slight margin of error to consider. Brands listed on this page are ranked in the top twenty within the market and product category by total retail sales volume.

