Nov-2025
Sales
Trend
6-Month
Product Count
SKUs
Avg Price
YoY Sales Change
YoY Price Change
Market Insights Snapshot
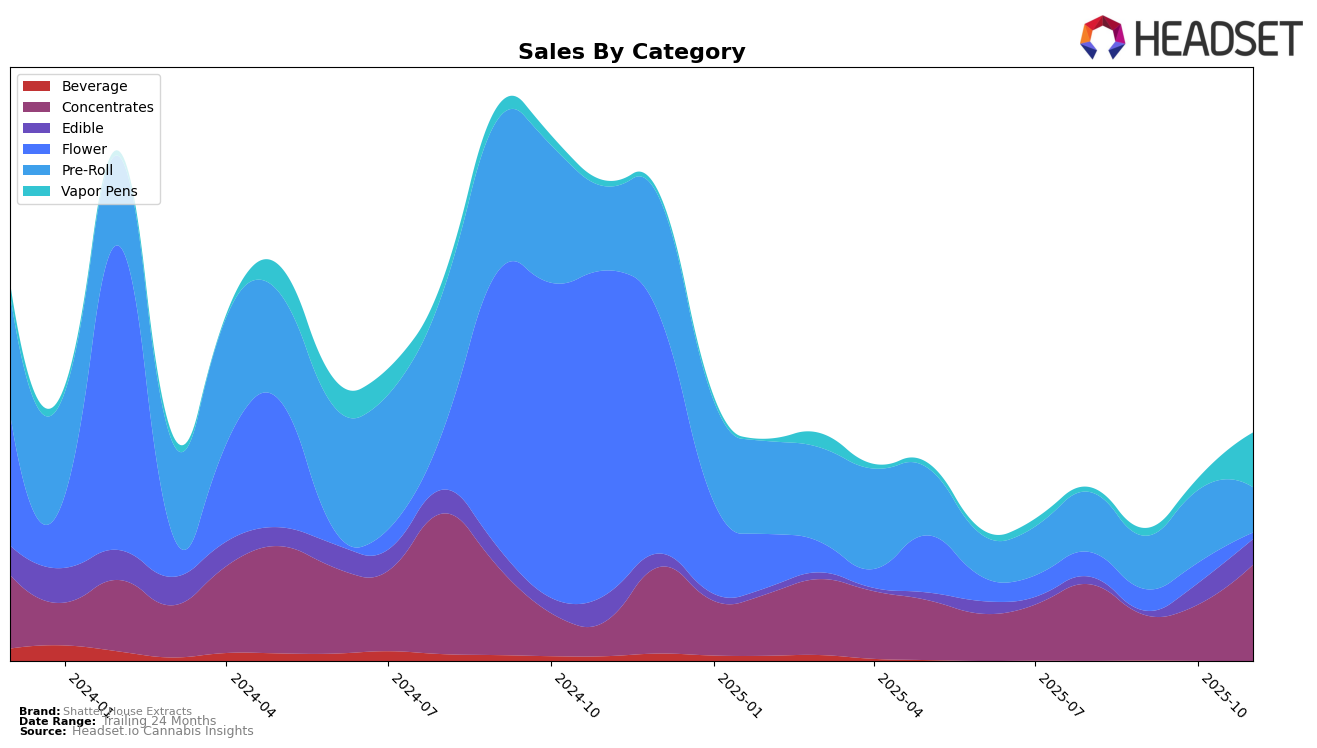
In Michigan, Shatter House Extracts has shown a notable upward trajectory in the Concentrates category. Starting from a rank of 40 in August 2025, the brand experienced some fluctuations but ultimately climbed to a rank of 28 by November. This improvement is indicative of a robust recovery, particularly given the dip to rank 53 in September. The sales figures reflect this trend, with a significant increase in November compared to previous months, suggesting a successful strategy in place. However, the brand did not make it into the top 30 brands in the Edible, Pre-Roll, or Vapor Pens categories, highlighting areas for potential growth and market penetration.
In the Edible category, Shatter House Extracts made its first appearance in the rankings in October 2025, entering at rank 83 and improving slightly to 75 by November. This movement, although outside the top 30, indicates a positive reception in the market. The Pre-Roll category saw the brand debut at rank 94 in October, while the Vapor Pens category saw them ranked 84 in November. The absence of Shatter House Extracts in the top 30 for these categories may reflect either limited market presence or competition from stronger brands. Nonetheless, the brand's entry into these categories suggests a strategic expansion effort that could pay dividends if sustained growth continues.
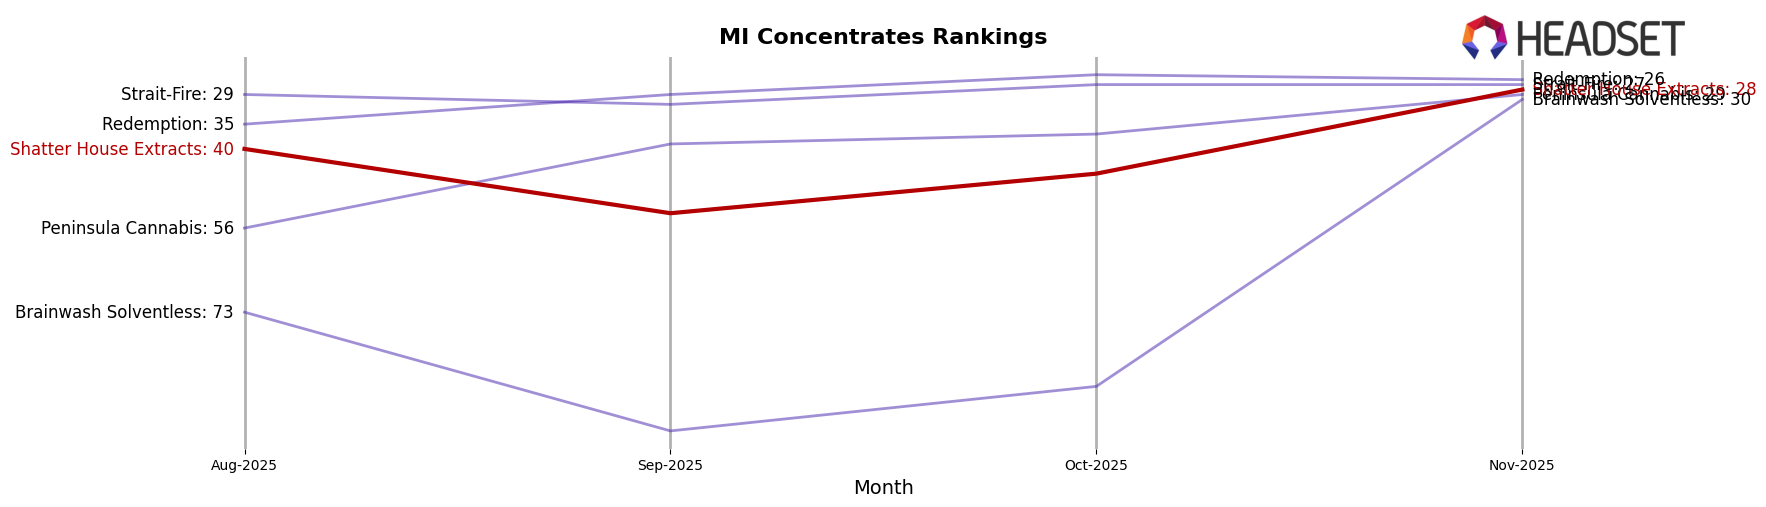
Competitive Landscape
In the Michigan concentrates market, Shatter House Extracts has demonstrated a notable recovery in its ranking from August to November 2025, moving from 40th to 28th position. This improvement is significant, especially when compared to competitors such as Peninsula Cannabis, which also improved its rank from 56th to 29th, and Brainwash Solventless, which made a remarkable leap from 73rd to 30th. Despite a dip in September, Shatter House Extracts' sales rebounded strongly by November, surpassing Peninsula Cannabis and closely trailing behind Redemption and Strait-Fire, both of which maintained more stable rankings in the top 30. This upward trend for Shatter House Extracts suggests a positive trajectory in market presence and consumer preference, positioning it well against its competitors in the coming months.
Notable Products
In November 2025, the top-performing product for Shatter House Extracts was the Tropicana Cookies Distillate Cartridge (1g) in the Vapor Pens category, achieving the number one rank with sales of 2,857 units. The Grape Gummies 10-Pack (200mg) from the Edible category improved from third place in October to second place in November. The Grand Daddy Purp Live Resin Cartridge (1g), also in the Vapor Pens category, secured the third position in its debut month. Blue Raspberry Gummies (200mg) maintained a solid performance, moving up from fifth to fourth place. Notably, the Pink Runtz Infused Pre-Roll (1g) experienced a drop from first place in August to fifth place in November, indicating a shift in consumer preferences.
Top Selling Cannabis Brands
Data for this report comes from real-time sales reporting by participating cannabis retailers via their point-of-sale systems, which are linked up with Headset’s business intelligence software. Headset’s data is very reliable, as it comes digitally direct from our partner retailers. However, the potential does exist for misreporting in the instance of duplicates, incorrectly classified products, inaccurate entry of products into point-of-sale systems, or even simple human error at the point of purchase. Thus, there is a slight margin of error to consider. Brands listed on this page are ranked in the top twenty within the market and product category by total retail sales volume.

