Jun-2026
Sales
Trend
6-Month
Product Count
SKUs
Avg Price
YoY Sales Change
YoY Price Change
Market Insights Snapshot
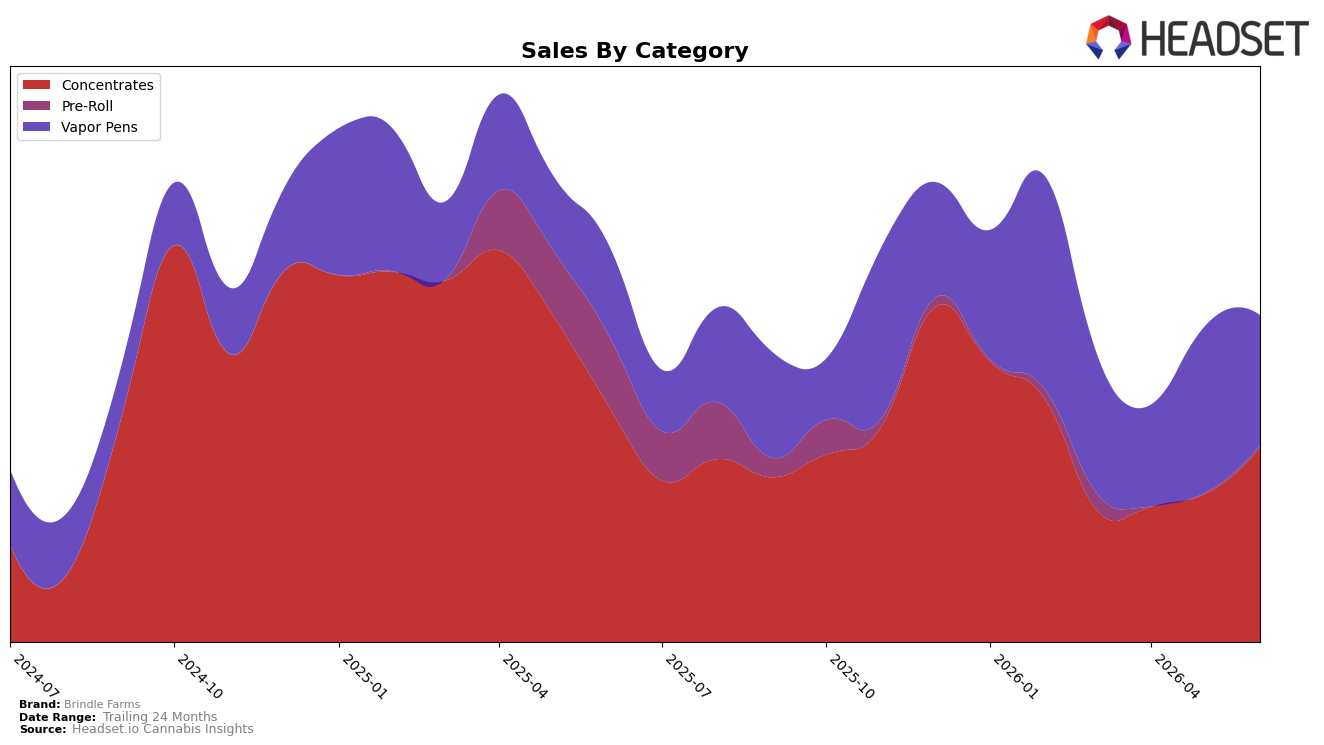
Brindle Farms concentrated its June 2026 revenue in Concentrates at 59.60% share and Vapor Pens at 39.92% share, while Pre-Roll was 0.49%. Within the month, Concentrates rose 31.64% MoM as Vapor Pens fell 21.77% MoM, and year over year Concentrates declined 17.77% while Vapor Pens grew 43.94% YoY; despite a 6.41% YoY increase in average price to $66.22, total brand sales were down 17.95% YoY. With a rank of 9 in Concentrates in British Columbia and a 31.64% MoM rebound in that category paired with a 21.77% MoM contraction in Vapor Pens, June 2026 shows a pivot back toward the legacy category mix even as YoY signals remain split, implying the month’s volume recovery leaned on Concentrates more than on Vapor Pens.
The combination of a 43.94% YoY upswing in Vapor Pens alongside a 17.77% YoY decline in Concentrates, yet a June 2026 mix still weighted 59.60% to Concentrates and 39.92% to Vapor Pens, indicates Brindle Farms is positioned as a Concentrates-first brand that is adding Vapor Pen relevance rather than replacing its core. The 131.50% MoM spike in Pre-Roll from a 0.49% base and a 21.77% MoM retreat in Vapor Pens, together with a 31.64% MoM advance in Concentrates and a 6.41% YoY average price lift, imply near-term share defense will come from reinforcing Concentrates where the brand holds rank 9 in British Columbia, while selectively nurturing Vapor Pens to convert its YoY momentum into steadier monthly contribution.
Competitive Landscape
Brindle Farms ranks #9 in BC Concentrates in June 2026, down 5 positions year over year from #4, and up 1 spot versus March 2026 when it was #10; this places the brand well below its category peak of #2 reached in October 2025 but above its recent quarterly trough by 10%. Competitively, Endgame holds #1 with a 13.8% year-over-year sales increase while BoxHot advanced to #3 from #10 with 109.6% year-over-year growth, indicating Brindle Farms is losing relative momentum as faster-rising rivals compress share. With a five-rank YoY decline alongside competitors gaining double- and triple-digit growth, the trajectory implies Brindle Farms must shift mix or pricing to arrest downward rank pressure despite modest quarter-on-quarter stabilization.

Notable Products
Animal Style Pure Live Rosin Cartridge (1g) posted the standout move in June 2026 with a 418.6% month-over-month surge, jumping to rank 3, while Black Maple Live Rosin Cartridge (1g) fell 73.9% to rank 8. Lemon Tree Pure Live Rosin Cartridge (1g) also accelerated 157.4% to rank 4, contrasting with Rainbow Belts Live Rosin Cartridge (1g) sliding 70.0% to rank 7. Four of the top ten are Vapor Pens SKUs concentrated in live rosin formats, indicating a rapid shift in demand toward rosin-based cartridges even as performance diverges sharply within the segment.
Top Selling Cannabis Brands
Data for this report comes from real-time sales reporting by participating cannabis retailers via their point-of-sale systems, which are linked up with Headset’s business intelligence software. Headset’s data is very reliable, as it comes digitally direct from our partner retailers. However, the potential does exist for misreporting in the instance of duplicates, incorrectly classified products, inaccurate entry of products into point-of-sale systems, or even simple human error at the point of purchase. Thus, there is a slight margin of error to consider. Brands listed on this page are ranked in the top twenty within the market and product category by total retail sales volume.

