.svg)

Sep-2026
Sales
Trend
6-Month
Product Count
SKUs
Avg Price
YoY Sales Change
YoY Price Change


Where to Buy
Buzz (NV) is stocked at 25 licensed dispensaries across Nevada, with the deepest coverage in Las Vegas, Reno, Henderson, Carson City, and Ely. Search by ZIP code or city below to find the closest one, or filter by product type if you are after a specific format.
Market Insights Snapshot
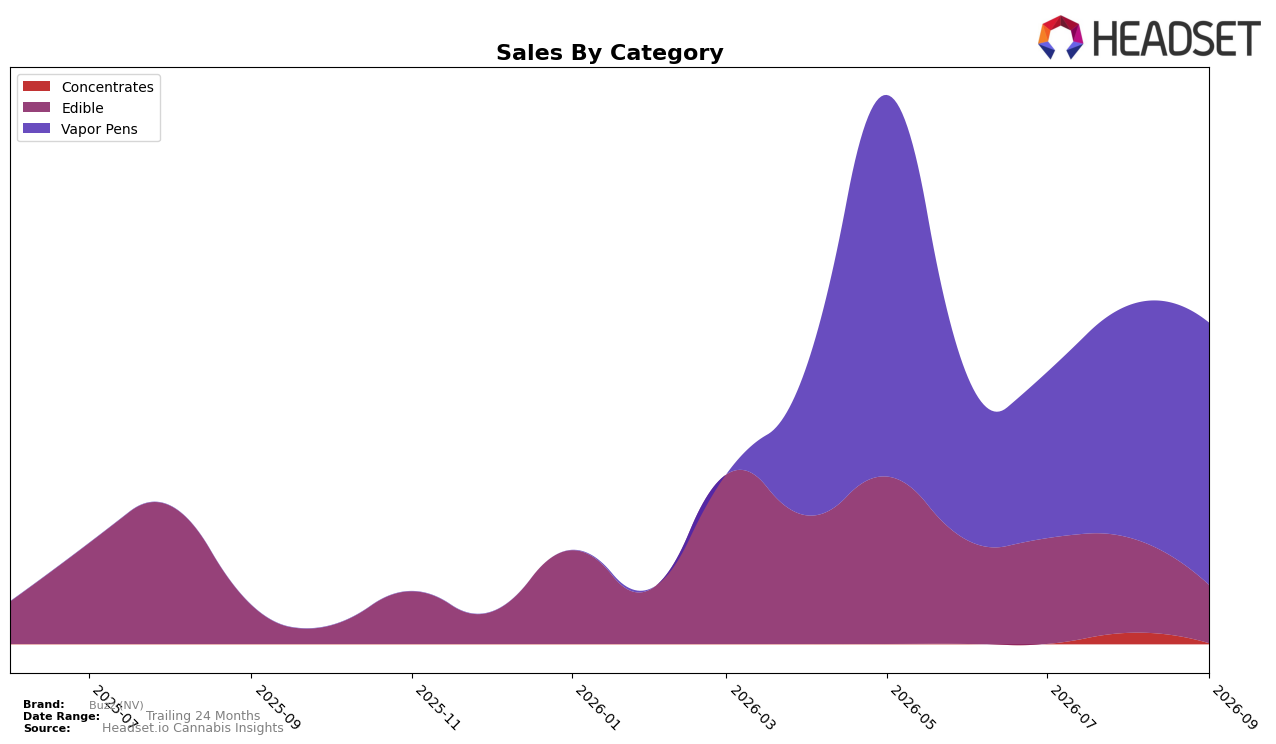
In September 2026, Buzz (NV) concentrated 81.75% of sales in Vapor Pens with a 13.20% month-over-month lift, while Edible held 18.04% share with a 49.87% year-over-year gain but a -39.27% month-over-month drop; Concentrates was 0.22% share with a -93.73% month-over-month decline. Despite brand-level sales up 730.93% year over year and average price up 48.85%, the mix reveals a pivot toward higher-priced Vapor Pens (average $25.75) as Edible volume receded near term, implying category dependence has intensified even as multi-category breadth narrowed.
Positioning in Nevada Vapor Pens sits at rank 47, paired with an 81.75% mix weight and a 13.20% month-over-month gain, indicating growth is leaning on a relatively low-ranked lane where price is materially above the brand’s overall average ($20.26). The -39.27% month-over-month contraction in Edible against a 49.87% year-over-year rise suggests episodic promotions or launch effects that did not sustain, so short-term share is likely to consolidate further in Vapor Pens while Concentrates’ -93.73% month-over-month drop removes a diversification buffer; together, this points to a strategy risk where pricing power is carried by Vapor Pens while rank 47 constrains visibility.
Competitive Landscape
Buzz (NV) sits at rank #47 in NV Vapor Pens in September 2026, improving 5 positions from #52 in June 2026, while its peak of #38 in May 2026 places the current slot 9 positions below that high; in contrast, Dime Industries climbed from #23 to #3 year over year with a 541.8% sales lift, and STIIIZY holds #2 despite a 47.4% YoY sales decline, indicating that Buzz (NV)’s mid-year slide followed by a recent 5-rank rebound points to stabilization rather than breakout momentum.

Notable Products
Galactic Grape Distillate Disposable (1g) posted the standout movement with a 103% month-over-month jump to rank 2, while Green Apple Distillate Disposable (1g) slid 37% to rank 7. Strawberry Kiwi Distillate Disposable (1g) rose 82% to rank 1, and Watermelon Mojito Distillate Disposable (1g) climbed 54% to rank 3, concentrating momentum at the top where four of the top ten are Vapor Pens. In contrast, CBD/THC 1:1 Pink Lemonade Gummies 10-Pack (100mg CBD, 100mg THC) fell 55% to rank 8, and Watermelon Splash Gummies 10-Pack (100mg) dropped 21% to rank 6, signaling category divergence between inhalables and edibles. Taken together, the surge in high-ranking Vapor Pens alongside double-digit edible declines implies Buzz (NV) is tilting its commercial mix toward fast-moving pen formats and away from slower edible lines, with upside concentrated in flavored distillate SKUs despite a $11,010 anchor sale from the top item.
Top Selling Cannabis Brands






Data for this report comes from real-time sales reporting by participating cannabis retailers via their point-of-sale systems, which are linked up with Headset’s business intelligence software. Headset’s data is very reliable, as it comes digitally direct from our partner retailers. However, the potential does exist for misreporting in the instance of duplicates, incorrectly classified products, inaccurate entry of products into point-of-sale systems, or even simple human error at the point of purchase. Thus, there is a slight margin of error to consider. Brands listed on this page are ranked in the top twenty within the market and product category by total retail sales volume.

