Market Insights Snapshot
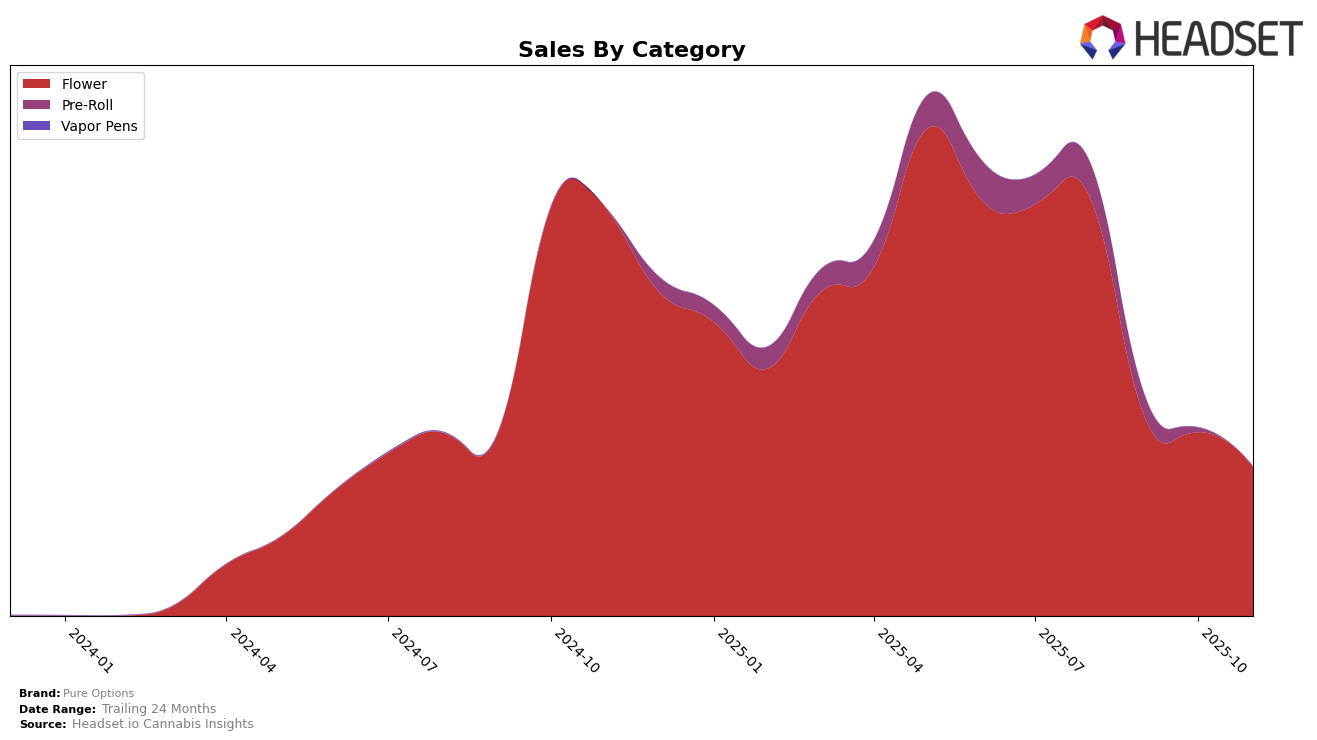
In the state of Michigan, Pure Options has shown varied performance across different product categories. In the Flower category, the brand has experienced a noticeable decline in its rankings over the months from August to November 2025. Starting at rank 8 in August, Pure Options dropped to rank 24 by November. This decline is mirrored by a decrease in sales, with November figures showing a significant reduction compared to August. This downward trend could suggest increased competition or a shift in consumer preferences within the Flower category. Meanwhile, the Pre-Roll category has seen even more challenges for Pure Options, as the brand did not make it into the top 30 rankings from October onwards, indicating a potentially weaker market presence in this segment.
Pure Options' performance highlights the challenges of maintaining strong market positions across multiple categories in a competitive state like Michigan. The absence of a ranking in the Pre-Roll category for October and November suggests that the brand may need to reassess its strategy or product offerings to regain traction. While specific sales figures for Pre-Rolls in these months are not available, the lack of a top 30 presence is a clear indicator of the hurdles Pure Options faces. These insights can be crucial for understanding the brand's current market dynamics and potential areas for improvement or strategic pivots.
Competitive Landscape
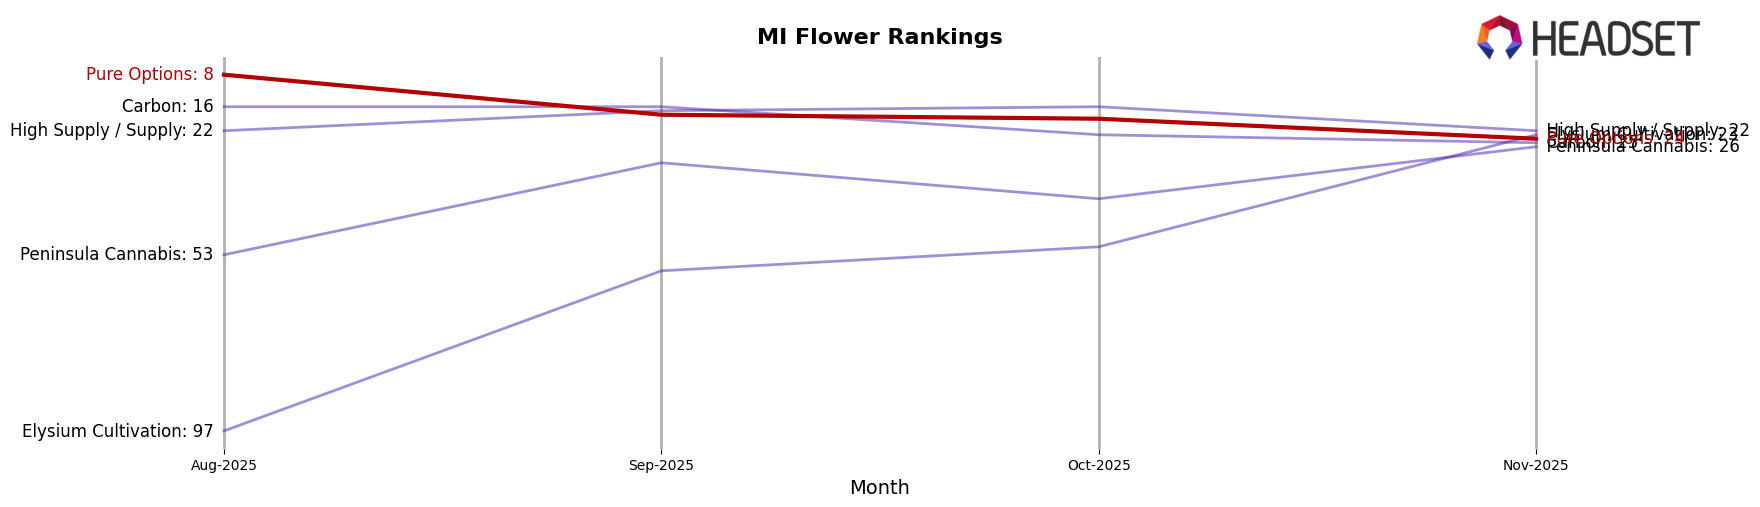
In the competitive landscape of the Michigan flower category, Pure Options has experienced a notable decline in its rankings over the past few months, dropping from 8th place in August 2025 to 24th place by November 2025. This downward trend in rank is mirrored by a decrease in sales, indicating potential challenges in maintaining market share. In contrast, Peninsula Cannabis has shown a significant improvement, climbing from 53rd to 26th place, suggesting a successful strategy in capturing consumer interest. Similarly, Elysium Cultivation has made impressive strides, moving from 97th to 23rd place, with sales nearly tripling over the same period. Meanwhile, High Supply / Supply and Carbon have maintained relatively stable positions, though Carbon has seen a slight dip in rank. These shifts highlight the dynamic nature of the Michigan flower market and underscore the importance for Pure Options to reassess its competitive strategies to regain its footing.
Notable Products
In November 2025, the top-performing product for Pure Options was Runtz Small Buds (7g) in the Flower category, maintaining its first-place ranking from October with notable sales of 16,380 units. Sherbanger Small (7g) improved its position from third to second place, despite a slight drop in sales figures. Kurogi Small Buds (7g) entered the rankings for the first time in November, securing the third position. Hollywood Guava Small (7g) fell from fifth to fourth place, indicating a decrease in sales performance. Meanwhile, Runtz Ready-To-Roll (28g) made its debut in the rankings at fifth place, showcasing its growing popularity.
Top Selling Cannabis Brands
Data for this report comes from real-time sales reporting by participating cannabis retailers via their point-of-sale systems, which are linked up with Headset’s business intelligence software. Headset’s data is very reliable, as it comes digitally direct from our partner retailers. However, the potential does exist for misreporting in the instance of duplicates, incorrectly classified products, inaccurate entry of products into point-of-sale systems, or even simple human error at the point of purchase. Thus, there is a slight margin of error to consider. Brands listed on this page are ranked in the top twenty within the market and product category by total retail sales volume.

