.svg)
Sep-2026
Sales
Trend
6-Month
Product Count
SKUs
Avg Price
YoY Sales Change
YoY Price Change


Market Insights Snapshot
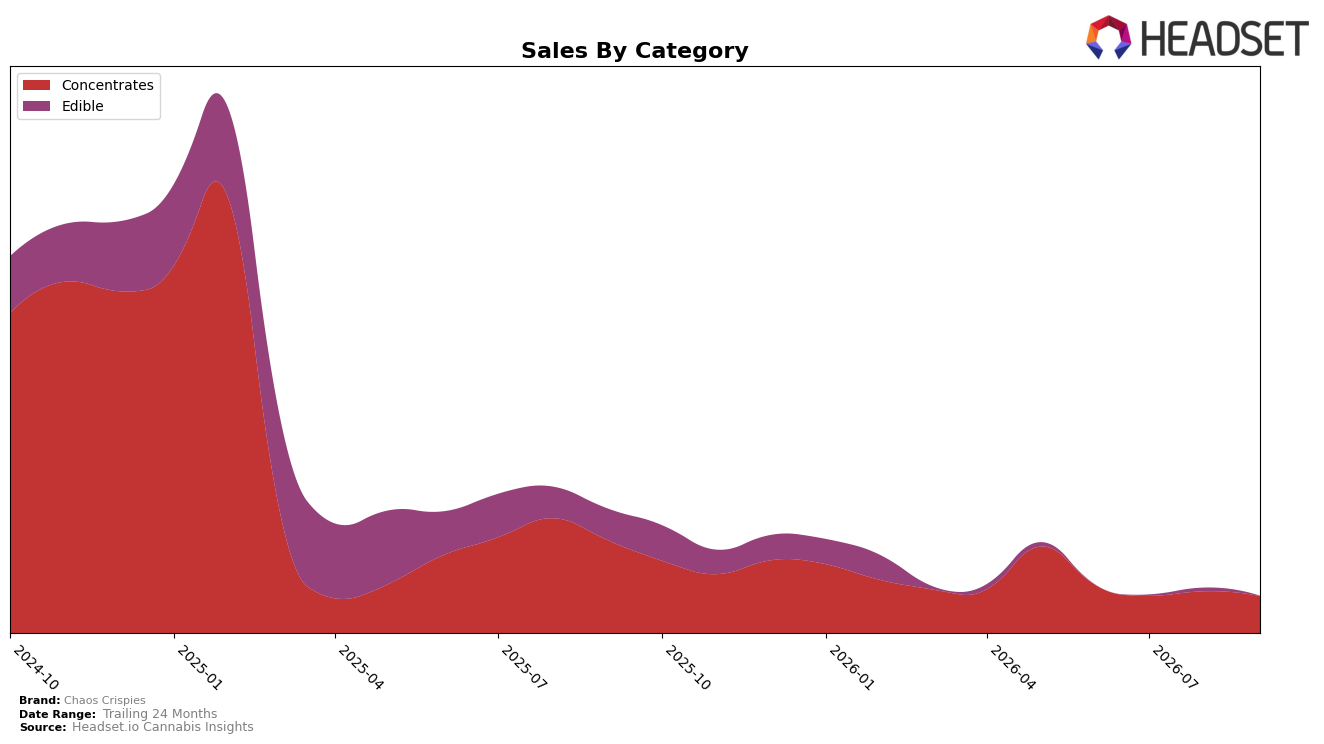
Concentrates account for 93.75% share in September 2026, with year-over-year sales down 58.64% and month-over-month down 10.86%, while Edible holds 6.25% share with a sharper year-over-year decline of 92.28% and a 55.86% month-over-month drop. The brand’s overall year-over-year sales contraction of 67.49% alongside a 35.66% year-over-year reduction in average price and a rank position of 47 in Colorado Concentrates indicates the mix is concentrated in a category with smaller declines than Edible but still losing momentum; the pattern implies a defensive tilt toward Concentrates that is not offsetting rapid attrition in Edible.
With Concentrates yielding a lower average price of $9.18 versus Edible at $11.19 and holding 93.75% share, the mix is skewed toward lower-priced volume even as September 2026 rank 47 in Colorado suggests mid-to-lower shelf presence within the category; coupled with a 10.86% month-over-month decline in Concentrates versus 55.86% in Edible, the brand is trading breadth for depth in a narrowing lane. The combination of a 35.66% average price drop year over year and a 78.17% two-year sales decline implies that price-led retention in Concentrates is not translating to sustained share or rank gains, pointing to a need to reposition within Concentrates while selectively pruning or re-pricing Edible to stabilize mix quality.
Competitive Landscape
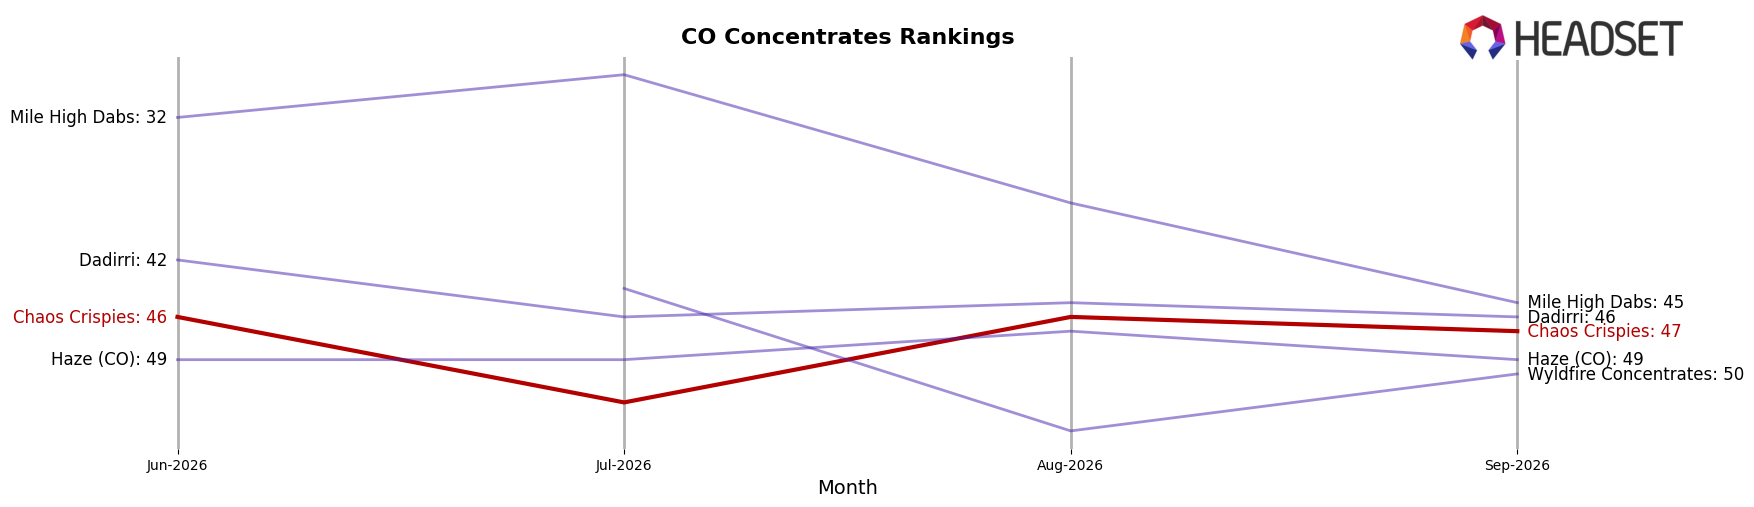
Chaos Crispies sits at rank #47 in CO Concentrates in September 2026, down 8 positions year over year from #39 and 1 position since June 2026 from #46, signaling a multi-quarter slide from a peak of #19 in February 2025 that widens its distance from the top tier where 710 Labs held #1 while slipping from #2 year over year and Sunshine Extracts advanced from #6 to #2 with roughly 49.9% YoY sales growth; against that backdrop, the brand’s rank erosion alongside competitors’ upward or defended positions implies that Chaos Crispies must reverse declining relative velocity or concede further share to faster-climbing rivals.
Notable Products
Crab Ragoon Wax (1g) delivered the headline move in September 2026 with a +97.9% MoM surge into rank 5, while Strawberry Cough Sugar Wax (1g) plunged -78.1% to rank 8, indicating a sharp reallocation of demand within the lineup. Divine Dream Sugar Wax (1g) held rank 1 with +16.3% MoM as Intergalactic Goat Wax (1g) slid -24.0% at rank 2, and Mr. G Wax (1g) declined -19.4% at rank 6, pointing to momentum clustering at the top and erosion in mid-tier SKUs. Girl Scout Cake Wax (1g) also accelerated +78.5% at rank 5, and with all top-10 entries in Concentrates and three SKUs showing double-digit declines, the mix implies Chaos Crispies is concentrating on a narrower set of winning wax profiles while cycling out underperformers even as total category dollars near 2,086 for the leader.
Top Selling Cannabis Brands






Data for this report comes from real-time sales reporting by participating cannabis retailers via their point-of-sale systems, which are linked up with Headset’s business intelligence software. Headset’s data is very reliable, as it comes digitally direct from our partner retailers. However, the potential does exist for misreporting in the instance of duplicates, incorrectly classified products, inaccurate entry of products into point-of-sale systems, or even simple human error at the point of purchase. Thus, there is a slight margin of error to consider. Brands listed on this page are ranked in the top twenty within the market and product category by total retail sales volume.

