.svg)

Sep-2026
Sales
Trend
6-Month
Product Count
SKUs
Avg Price
YoY Sales Change
YoY Price Change


Market Insights Snapshot
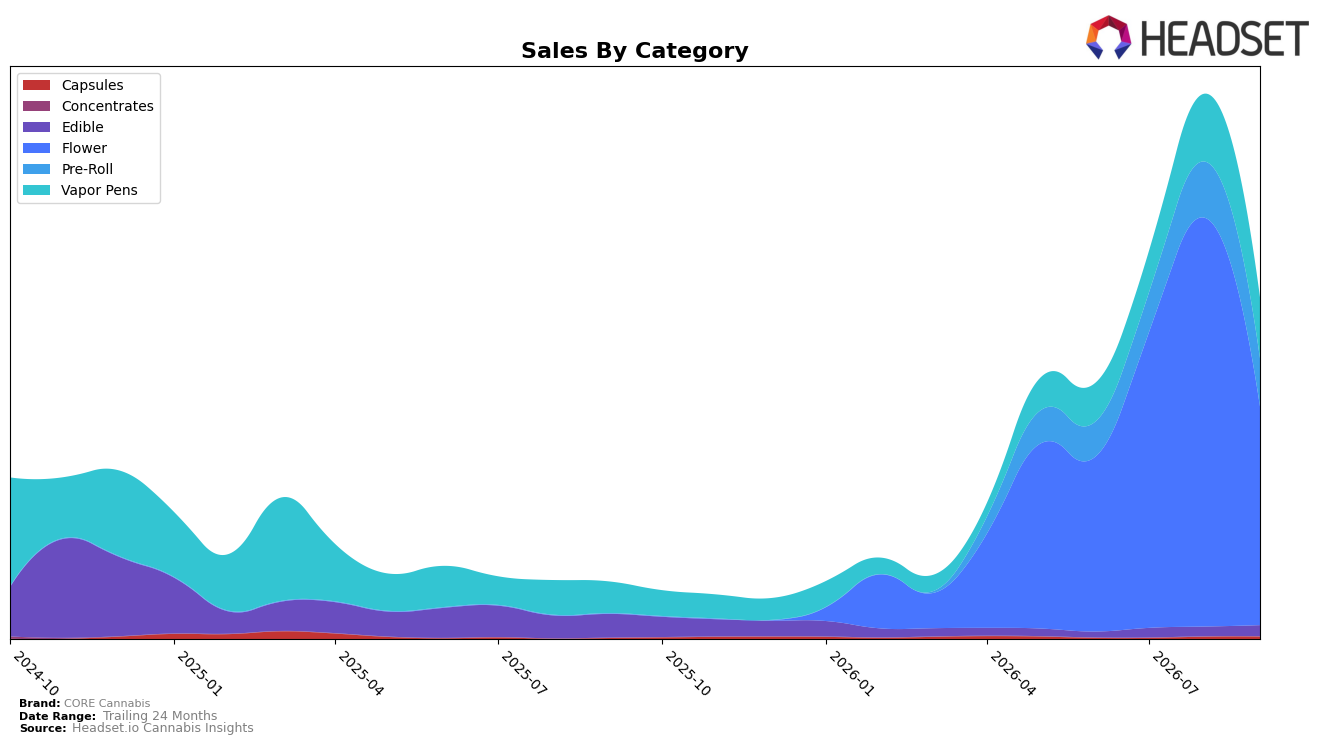
CORE Cannabis concentrated 64.28% of September 2026 sales in Flower while Vapor Pens and Pre-Roll held 17.83% and 14.11% share, respectively, indicating a three-category core that accounts for 96.22% of mix. Within-month dynamics were uneven: Flower fell 46.57% month over month and Pre-Roll declined 14.10% month over month, while Vapor Pens slipped 10.34% month over month and Edible rose 13.41% month over month; year over year, Vapor Pens grew 92.86% and Capsules expanded 190.45% despite Edible contracting 54.47% year over year. Coupled with an overall brand sales expansion of 512.39% year over year and a 23.27% lift in average price, the pattern implies the brand is migrating away from volume-dependent Flower toward a higher-margin, premium-leaning blend where Vapor Pens and Capsules are the incremental growth engines even as Flower remains the anchor.
Positionally, ranking 16th in Flower in Nevada sets a ceiling for share capture when the core category posts a 46.57% month-over-month drop, but the 92.86% year-over-year gain in Vapor Pens and the 190.45% year-over-year gain in Capsules suggest headroom in segments where the brand is less constrained by legacy rank. With Vapor Pens at a 17.83% share and Pre-Roll at 14.11% share, incremental shifts of even 2–3 share points away from Flower could mitigate monthly volatility while preserving the 512.39% brand-level year-over-year growth; the implication is a portfolio reweighting play that leans into fast-growing, price-tolerant formats to stabilize mix against Flower’s rank-bound swings in Nevada.
Competitive Landscape
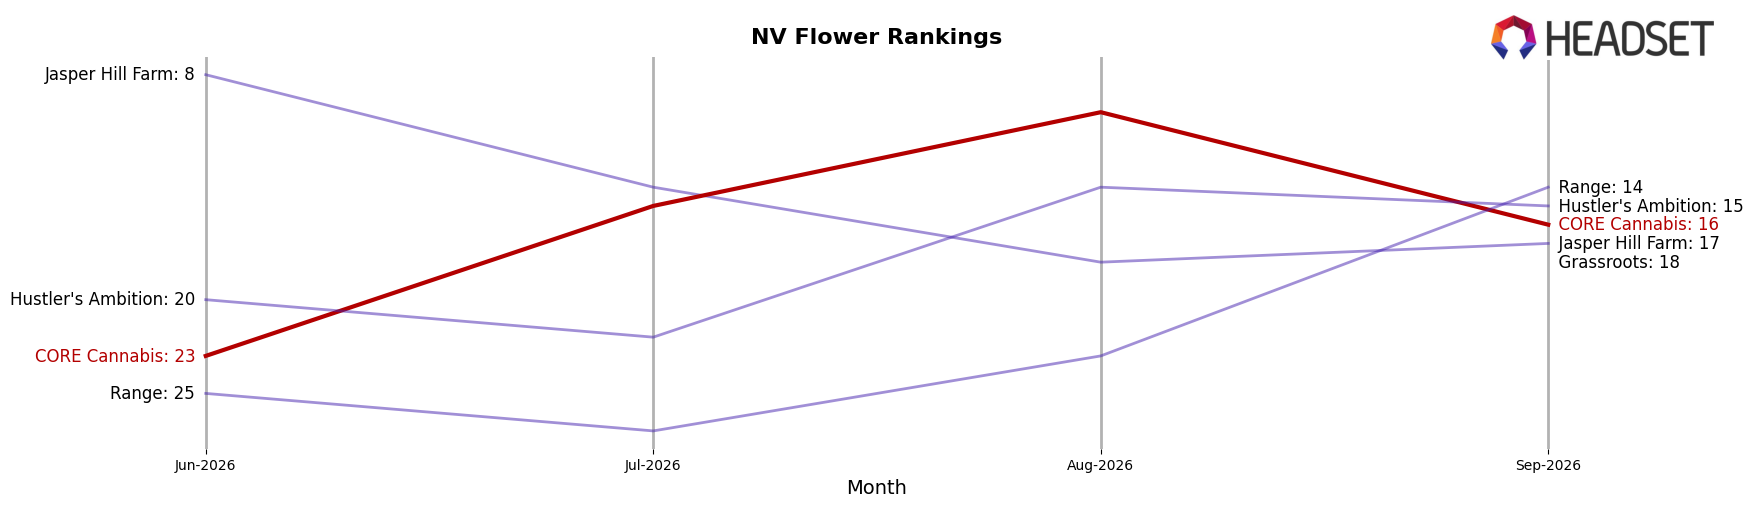
CORE Cannabis sits at rank 16 in Nevada Flower in September 2026, improving 7 positions from rank 23 in June 2026 but without a published year-over-year rank; this recovery follows a peak at rank 10 in August 2026 before a 6-place slide back to 16, indicating volatility rather than linear momentum. Competitively, RYTHM held rank 1 and maintained its year-over-year rank at 1 while growing sales by 19.7%, and Neon Moon advanced to rank 4 from rank 9 year over year alongside an 82.7% sales lift—both moving directionally ahead of CORE Cannabis despite CORE’s 30% quarter-on-quarter rank gain from 23 to 16. The pattern implies CORE Cannabis is capable of short-cycle climbs but is being outpaced by leaders consolidating top-5 positions, so sustaining share will likely require converting brief peaks into steadier rank retention against competitors rising 5 to 9 positions year over year.
Notable Products
Oil Spill (3.5g) posted the steepest move in September 2026 with a -68.2% month-over-month decline while falling to rank 10, and Lemon Bars (3.5g) also slid -62.7% at rank 5, indicating acute volatility at the lower end of the Flower lineup. In contrast, Peanut Butter Breath (3.5g) climbed +27.8% MoM to rank 3 as Blue Diesel (3.5g) and MAC (3.5g) held ranks 1 and 2, respectively, concentrating three of the top five in Flower and signaling share consolidation around a few flagship eighths. Pre-Roll softness was broad with Lemon Bars Pre-Roll (1g) down -28.1% at rank 4 and Blue Diesel Pre-Roll (1g) down -19.5% at rank 6, while Vapor Pens held a foothold at rank 9 without a comparable MoM lift, suggesting mix pressure away from quick-consumption formats. The pattern implies CORE Cannabis is leaning into core Flower SKUs for volume while pruning or deprioritizing underperforming Flower variants and Pre-Rolls to stabilize rank positions and margin, with a single Vapor Pens entry acting as a secondary pillar rather than a growth engine.
Top Selling Cannabis Brands






Data for this report comes from real-time sales reporting by participating cannabis retailers via their point-of-sale systems, which are linked up with Headset’s business intelligence software. Headset’s data is very reliable, as it comes digitally direct from our partner retailers. However, the potential does exist for misreporting in the instance of duplicates, incorrectly classified products, inaccurate entry of products into point-of-sale systems, or even simple human error at the point of purchase. Thus, there is a slight margin of error to consider. Brands listed on this page are ranked in the top twenty within the market and product category by total retail sales volume.

