Aug-2025
Sales
Trend
6-Month
Product Count
SKUs
Avg Price
YoY Sales Change
YoY Price Change
Market Insights Snapshot
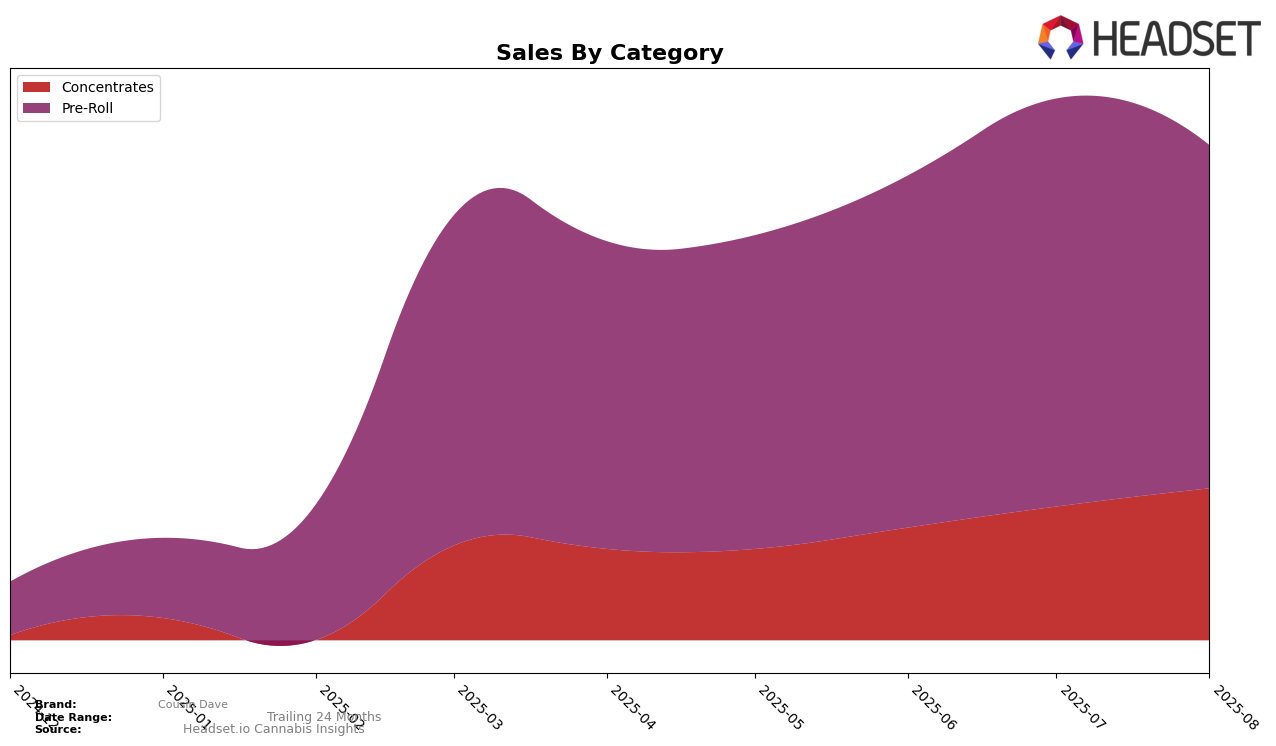
In Missouri, Cousin Dave has shown a notable upward trend in the Concentrates category over the summer months of 2025. Starting from a rank of 33 in May, the brand climbed to 25 by August, indicating a steady improvement in market presence. This positive trajectory is supported by a consistent increase in sales, culminating in August with sales reaching 65,018. Such progress suggests that Cousin Dave is effectively capturing consumer interest in the Concentrates segment, positioning itself as a growing contender within the state.
Conversely, Cousin Dave's performance in the Pre-Roll category in Missouri presents a different narrative. While the brand maintained a stable rank just outside the top 30 in May and June, it experienced a slight decline, falling to 34th in August. Despite a spike in sales in July, the subsequent decrease in both rank and sales in August could indicate challenges in sustaining momentum in this category. This divergence in performance across categories highlights the varying dynamics Cousin Dave faces within the Missouri market.
Competitive Landscape
In the competitive landscape of Missouri's Pre-Roll category, Cousin Dave has experienced notable fluctuations in its ranking and sales performance from May to August 2025. Cousin Dave maintained a relatively stable position, with its rank hovering around the low 30s, peaking at 31st in both June and July before slipping slightly to 34th in August. Despite these fluctuations, Cousin Dave's sales showed a positive trend, particularly in July when sales peaked, suggesting effective marketing or product strategies during that period. In contrast, competitors like CLOVR and Sublime demonstrated more volatile rankings, with CLOVR dropping from 25th to 35th by August, indicating potential challenges in maintaining market share. Meanwhile, Rooted (MO) and Farmer G remained outside the top 30, highlighting Cousin Dave's relative strength in this competitive market. These dynamics underscore the importance of strategic positioning and adaptability for Cousin Dave to capitalize on its upward sales momentum and improve its ranking amidst fluctuating competitor performance.

Notable Products
In August 2025, the top-performing product from Cousin Dave was the Super Lemon Haze Pre-Roll (1g) in the Pre-Roll category, securing the number one spot with sales of 1502 units. Following closely was the Tropicana Banana Pre-Roll 5-Pack (2.5g) ranked second with notable sales figures. The Super Lemon Haze Pre-Roll 5-Pack (2.5g) maintained a consistent presence, ranking third, after previously being third in May and fifth in June. Blue Dream Pre-Roll 5-Pack (2.5g) made a strong entry at fourth place in August. Zoap Pre-Roll (1g) saw a drop from first in July to fifth in August, indicating a shift in consumer preference.
Top Selling Cannabis Brands
Data for this report comes from real-time sales reporting by participating cannabis retailers via their point-of-sale systems, which are linked up with Headset’s business intelligence software. Headset’s data is very reliable, as it comes digitally direct from our partner retailers. However, the potential does exist for misreporting in the instance of duplicates, incorrectly classified products, inaccurate entry of products into point-of-sale systems, or even simple human error at the point of purchase. Thus, there is a slight margin of error to consider. Brands listed on this page are ranked in the top twenty within the market and product category by total retail sales volume.

