.svg)

Aug-2026
Sales
Trend
6-Month
Product Count
SKUs
Avg Price
YoY Sales Change
YoY Price Change


Where to Buy
Cubano is stocked at 46 licensed dispensaries across Missouri, with the deepest coverage in Kansas City, St. Louis, Columbia, Florissant, and Lees Summit. Search by ZIP code or city below to find the closest one, or filter by product type if you are after a specific format.
Market Insights Snapshot
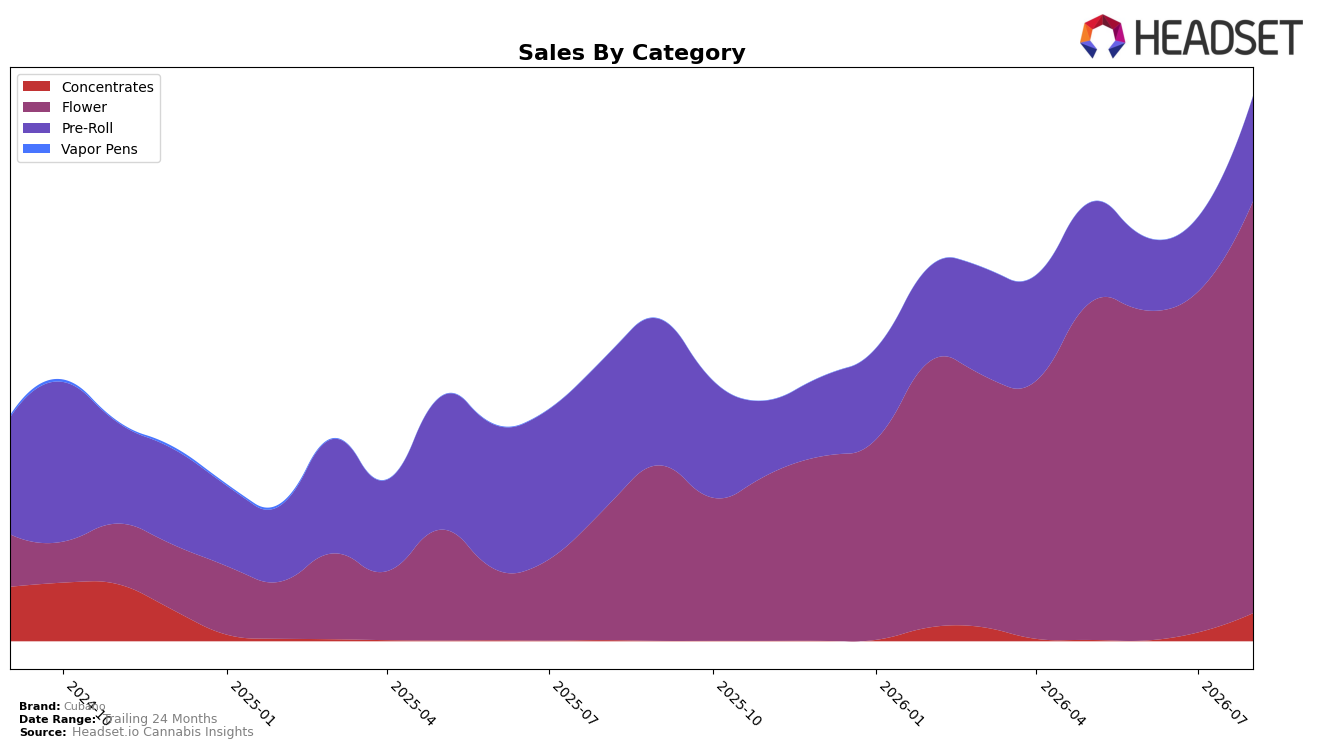
In August 2026, Cubano’s category mix tilted heavily toward Flower at 75.62% share with year-over-year growth of 216.04% and month-over-month growth of 21.07%, while Pre-Roll held 19.26% share with a year-over-year decline of 30.28% but a month-over-month rise of 41.36%. Concentrates, though just 5.12% share, posted a year-over-year surge of 3,548.34% and a month-over-month jump of 225.96%, alongside an overall brand sales year-over-year increase of 93.40% and an average price year-over-year increase of 11.06% to $18.84. This configuration implies Cubano is consolidating volume in Flower while using rapid, low-base gains in Concentrates and a Pre-Roll rebound to diversify growth vectors.
Positionally, a 75.62% Flower dependence paired with a Missouri Flower rank of 30 suggests Cubano is competing mid-pack in its anchor category even as Concentrates’ 225.96% month-over-month and 3,548.34% year-over-year spikes signal whitespace capture outside the core. The divergence between Pre-Roll’s 30.28% year-over-year decline and 41.36% month-over-month uptick, combined with Flower’s 21.07% month-over-month growth, indicates near-term share stabilization with upside skewed to non-Flower experimentation; together these shifts imply the brand’s pricing power (+11.06% YoY) and category breadth can support a move from rank-driven Flower reliance toward a more resilient multi-category position.
Competitive Landscape
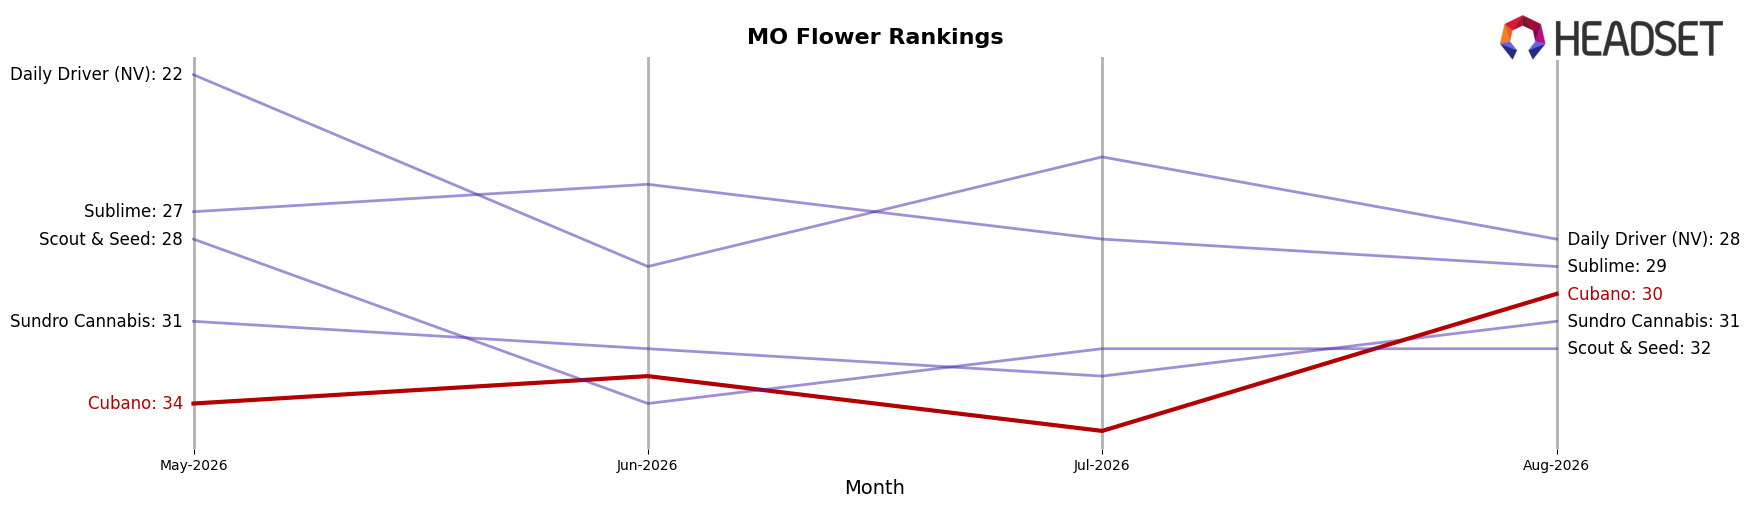
Cubano is ranked #30 in MO Flower in August 2026, improving 16 positions from #46 year over year and edging up 4 spots from #34 since May 2026; this matches a new peak rank of #30 in August 2026 while the category leaders remained concentrated at the top. In contrast, Farmer G advanced from #31 to #5 with a 434.6% year-over-year sales increase, while Illicit / Illicit Gardens moved from #3 to #2 despite a 5.0% year-over-year sales decline, indicating that mid-tier gains require faster relative momentum than incumbents’ incremental changes. The pattern implies Cubano’s upward trajectory is real but, given the 16-position YoY climb to #30 alongside competitors’ steeper ascents and top-tier stability, the brand must accelerate share capture to translate rank recovery into material competitive pressure.
Notable Products
Cherry Gar-See-Ya Distillate Infused Pre-Ground Shake (3.5g) posted the steepest movement in August 2026 with a -56.5% month-over-month drop and fell to rank 9, while French Royale Distillate Infused Pre Ground (3.5g) slipped -10.4% and held rank 6. In contrast, Glitter Bomb Pre-Roll (0.5g) climbed +37.1% month over month to rank 2, and French Royale Pre-Roll (0.5g) eased -6.2% at rank 1 with about $20.9K in sales. Six of the top ten are Pre-Roll SKUs, concentrated across single 0.5g and 1g formats, which implies Cubano is tilting toward lighter-weight, repeatable Pre-Roll velocity while pulling back from infused pre-ground Flower volatility.
Top Selling Cannabis Brands






Data for this report comes from real-time sales reporting by participating cannabis retailers via their point-of-sale systems, which are linked up with Headset’s business intelligence software. Headset’s data is very reliable, as it comes digitally direct from our partner retailers. However, the potential does exist for misreporting in the instance of duplicates, incorrectly classified products, inaccurate entry of products into point-of-sale systems, or even simple human error at the point of purchase. Thus, there is a slight margin of error to consider. Brands listed on this page are ranked in the top twenty within the market and product category by total retail sales volume.

