Market Insights Snapshot
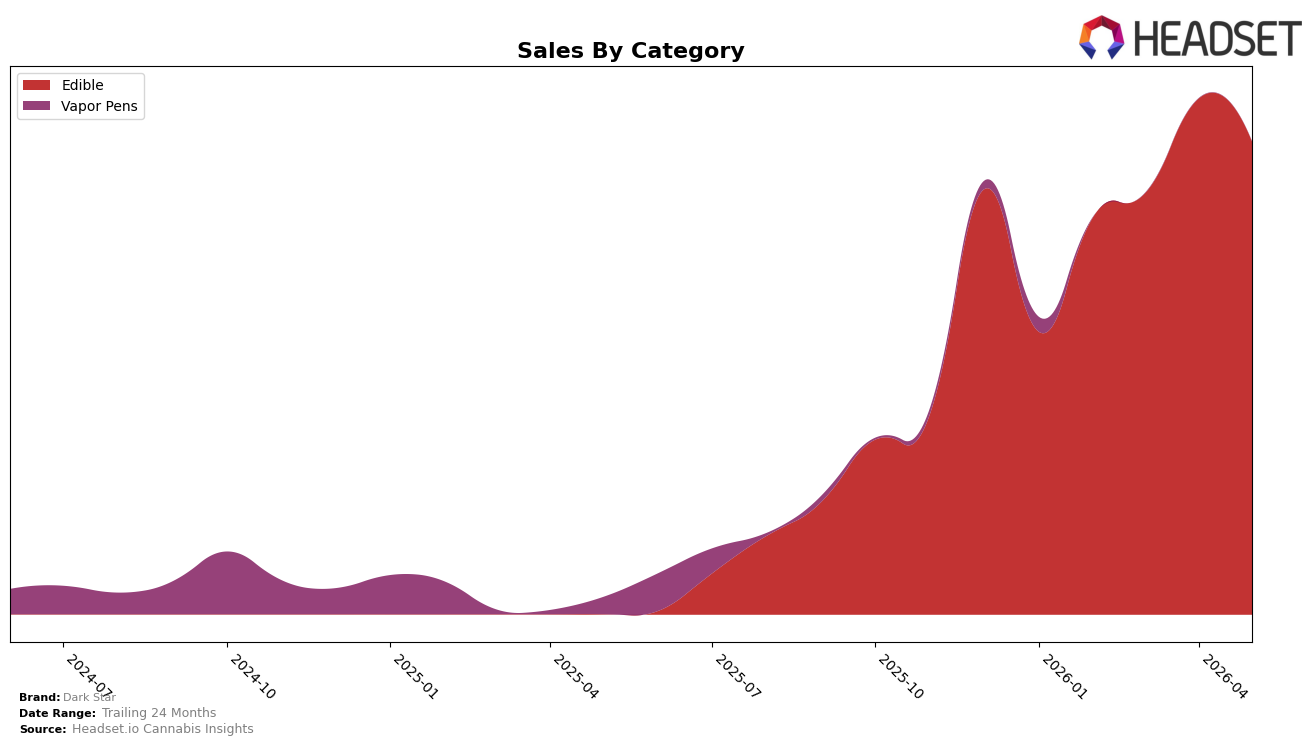
In May 2026, Dark Star operated as a single-category brand with Edible at 100.0% of mix and a category rank of 29 in New York, while month-over-month sales in Edible declined 8.34% and average price stood at $13.42 alongside a 35.81% YoY price decrease. Despite the category concentration, total brand sales expanded 2,687.80% year over year and 1,080.39% over 24 months, implying that unit growth offset pricing compression and that the MoM contraction is a pacing issue rather than a structural retreat.
The combination of a 100.0% Edible mix and a 35.81% YoY price drop against a 2,687.80% sales surge positions Dark Star as a value-led Edible player aiming for volume capture, with the -8.34% MoM dip signaling sensitivity to short-cycle demand shifts rather than a change in strategic focus. Holding rank 29 in New York Edibles while sustaining 1,080.39% growth over 24 months suggests room to trade up price selectively without eroding the volume base, and that tighter price architecture could convert May 2026’s MoM pullback into steadier rank gains.
Competitive Landscape
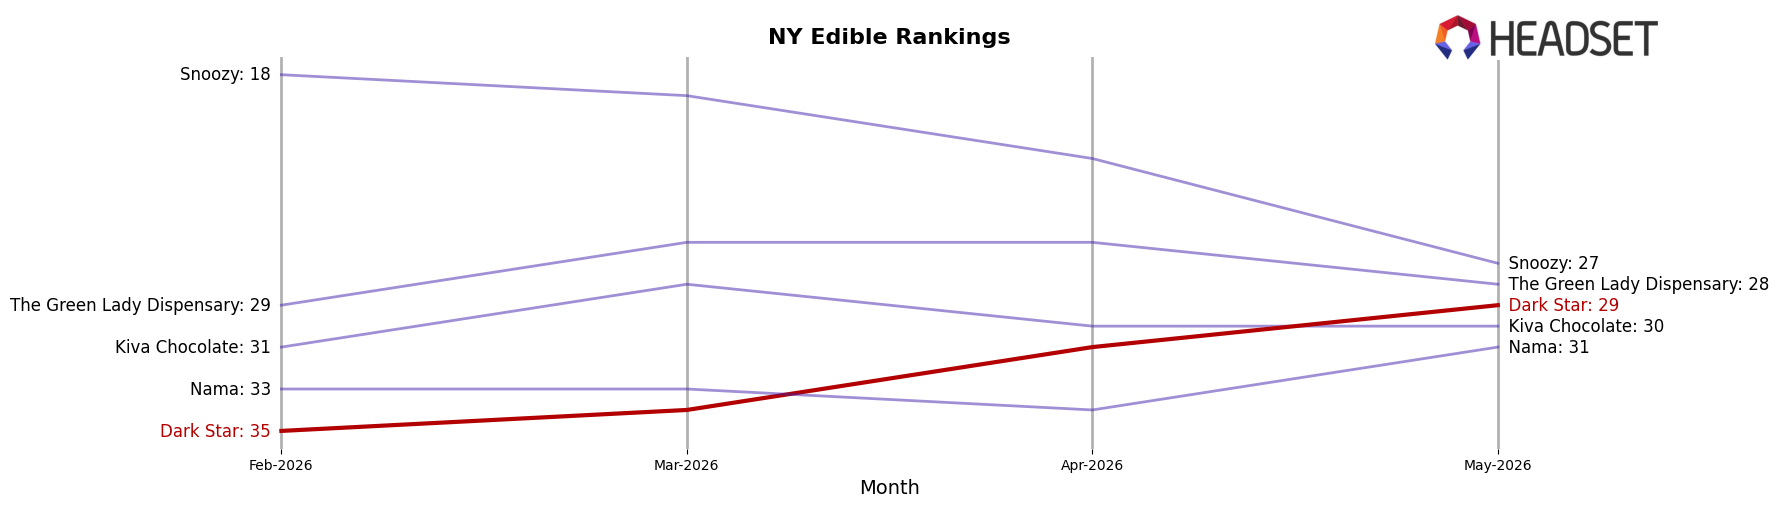
Dark Star ranks #29 in NY Edible in May 2026, improving 6 positions from #35 in February 2026, and marking a peak rank of #29 in May 2026; meanwhile, Off Hours holds #2 after a YoY move to #1 earlier in the year, and Wyld sits at #3 with a 25.11% YoY sales increase versus Dark Star’s lower placement implying weaker velocity at the shelf despite recent rank gains. Against the category leader, Camino at #1 with a 2-position YoY climb and 15.86% YoY sales growth, Dark Star’s ascent from #35 to #29 over three months signals distribution or SKU activation progress but still a wide gap to top-5 peers; this trajectory implies Dark Star is moving out of the long tail but must convert recent placement gains into sustained share capture to avoid stalling below the top 25.
Notable Products
Daytime Chocolate Crunchy Toffee Topped Bullet Bar (100mg) posted the standout move in May 2026 with a 75.6% month-over-month increase and climbed to rank 4, while the THC/CBN 2:1 Night Time Plain Dark Bullet Bar Chocolate (100mg THC, 50mg CBN) rose 17.9% and held rank 3; by contrast, the Anytime - CBG/THC 1:2 Cookies & Cream White Chocolate Bullet Bar (50mg CBG, 100mg THC) fell 14.1% yet remained rank 1. Two CBG-forward SKUs declined double digits at ranks 1 and 2 with -14.1% and -20.4%, respectively, even as the night-focused CBN SKU expanded, and Edibles accounted for all top-5 placements. The top SKU still led on dollars at $26,391 while ceding momentum to non-CBG formats, and four of the top ten are Edible SKUs by concentration within the available ranks. The pattern implies a pivot away from CBG-led daytime formulas toward differentiated use-case bars, with night and indulgent formats gaining transactional pull despite leadership concentration at the top.
Top Selling Cannabis Brands
Data for this report comes from real-time sales reporting by participating cannabis retailers via their point-of-sale systems, which are linked up with Headset’s business intelligence software. Headset’s data is very reliable, as it comes digitally direct from our partner retailers. However, the potential does exist for misreporting in the instance of duplicates, incorrectly classified products, inaccurate entry of products into point-of-sale systems, or even simple human error at the point of purchase. Thus, there is a slight margin of error to consider. Brands listed on this page are ranked in the top twenty within the market and product category by total retail sales volume.

