.svg)


Market Insights Snapshot
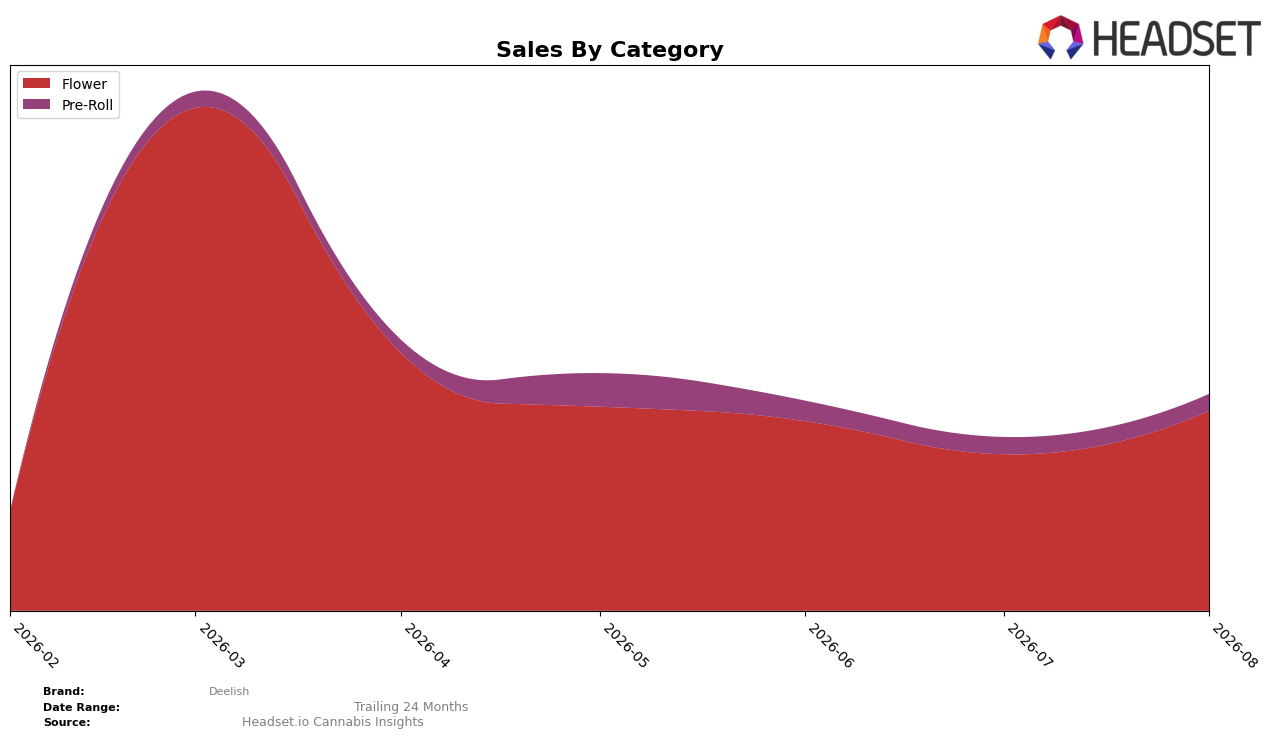
In August 2026, Deelish concentrated 91.06% of sales in Flower while Pre-Roll accounted for 8.94%, a spread that widened month over month as Flower grew 27.25% and Pre-Roll declined 1.98%. Average price diverged sharply across the mix, with Flower at 86.64 versus Pre-Roll at 9.96, reinforcing the revenue skew even as the overall brand average price sat at $51.33. With Flower ranked 36 in Alberta, the combination of a 27.25% Flower uptick and an 8.94% Pre-Roll share signals a portfolio pulling volume into higher-priced units while trimming exposure to lower-priced formats, implying the brand is leaning into premiumized Flower to drive near-term velocity and rank stability.
The shift toward a 91.06% Flower share alongside a 1.98% Pre-Roll contraction implies Deelish is prioritizing depth over breadth, trading variety for higher ticket transactions that can support pricing power at an 86.64 average price point. Given the 36 rank in Alberta Flower and a 27.25% month-over-month gain concentrated in the lead category, the positioning thesis is to consolidate in a core where price elasticity is favorable while using the 8.94% Pre-Roll presence as a controlled entry point rather than a growth engine, which implies sustained focus on premium Flower to climb category ranks without diluting mix.
Competitive Landscape
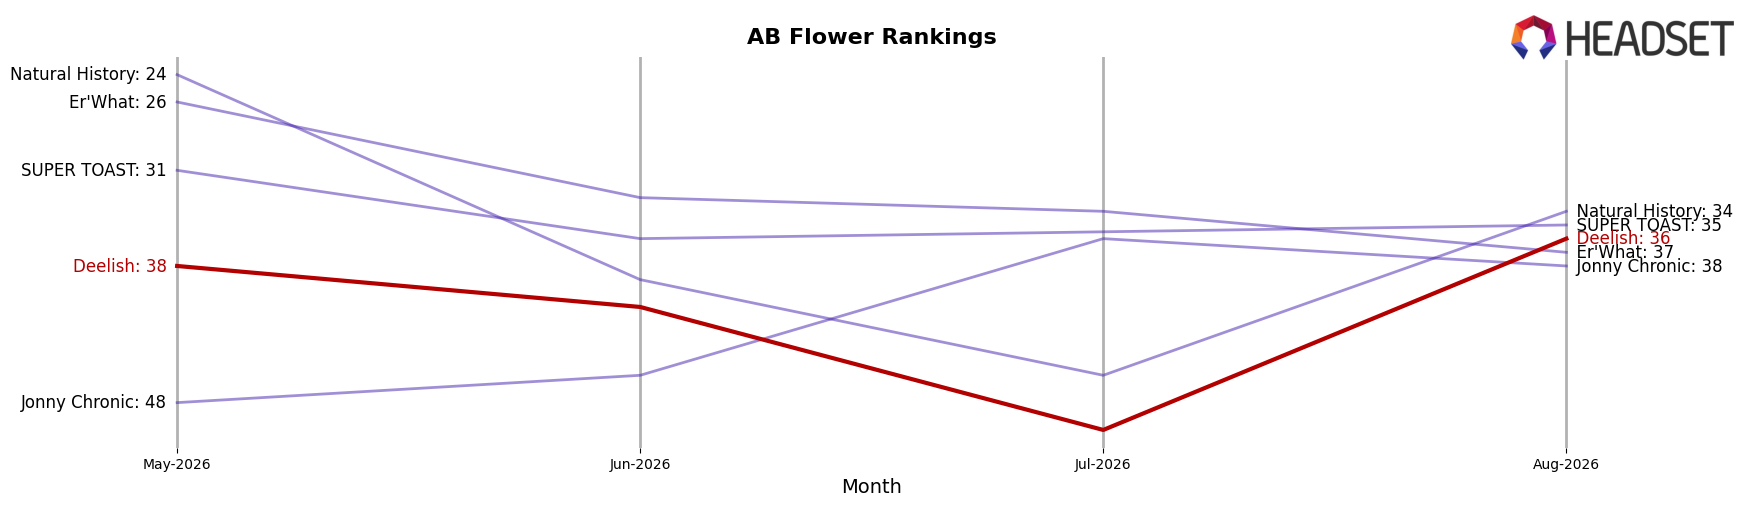
Deelish sits at #36 in AB Flower in August 2026, up 2 positions from #38 in May 2026, yet down from its peak of #12 in March 2026; this mid-year recovery contrasts with FIGR holding #1 after a 10-place YoY climb and with Spinach advancing to #2 with a 5-rank YoY gain. While Back Forty / Back 40 Cannabis sits at #3 despite a -8.31% YoY sales change and Pure Sunfarms is #5 with +15.22% YoY sales, Deelish’s slide from #12 to #36 alongside a modest three-month uptick implies the brand is stabilizing at a lower tier and will require share capture from top-5 incumbents to reverse a longer-term downtrend.
Notable Products
Pass n Dream (28g) posted the standout movement in August 2026 with a 59.96% month-over-month increase, vaulting into rank 6 while Pretty Sweet -Sativa (28g) rose 17.96% at rank 2. Meanwhile, Pretty Chill -Indica (28g) climbed 39.17% to rank 3 as Pretty Chill Pre-Roll 2-Pack (2g) slipped 1.96% while holding rank 1. Four of the top six are Flower SKUs, concentrating share in larger-format bags as Pre-Roll positions at ranks 1 and 4 posted sub-2% declines. The pattern implies a pivot toward high-velocity Flower led by value ounces, signaling assortment and pricing power are tilting toward bulk formats over smaller impulse units.
Top Selling Cannabis Brands






Data for this report comes from real-time sales reporting by participating cannabis retailers via their point-of-sale systems, which are linked up with Headset’s business intelligence software. Headset’s data is very reliable, as it comes digitally direct from our partner retailers. However, the potential does exist for misreporting in the instance of duplicates, incorrectly classified products, inaccurate entry of products into point-of-sale systems, or even simple human error at the point of purchase. Thus, there is a slight margin of error to consider. Brands listed on this page are ranked in the top twenty within the market and product category by total retail sales volume.

