Jun-2026
Sales
Trend
6-Month
Product Count
SKUs
Avg Price
YoY Sales Change
YoY Price Change
Market Insights Snapshot
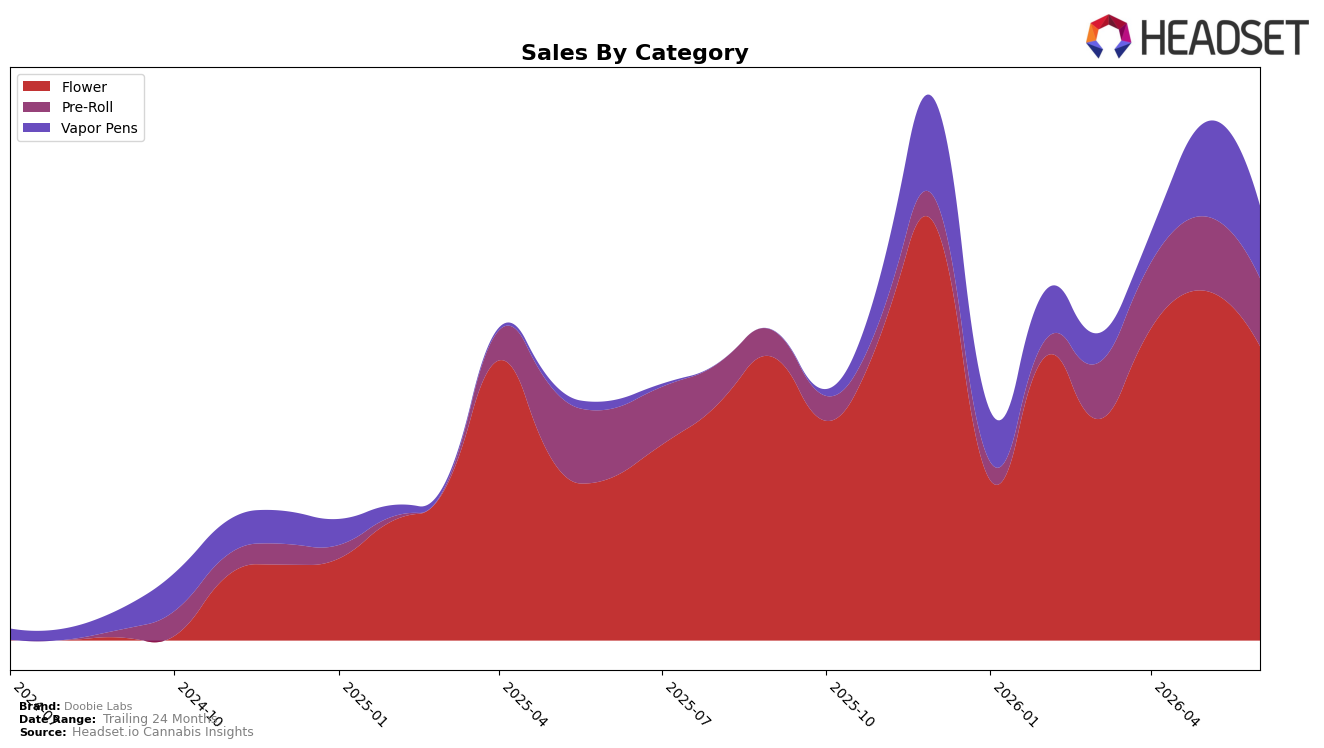
In June 2026, Doobie Labs concentrated 67.78% of sales in Flower with a year-over-year change of 82.38% but a month-over-month decline of 15.87%, while Vapor Pens rose 799.53% year over year to 16.64% share yet fell 22.77% month over month. Pre-Roll held 15.59% share with a 2.29% year-over-year decrease and an 8.56% month-over-month drop, alongside an overall average price down 3.23% year over year to $44.51. The pattern implies the brand is adding volume through lower-priced mix and faster-growing subsegments on an annual basis, but the June pullback across all three categories indicates sensitivity to short-cycle demand and pricing pressure within its Flower-led portfolio.
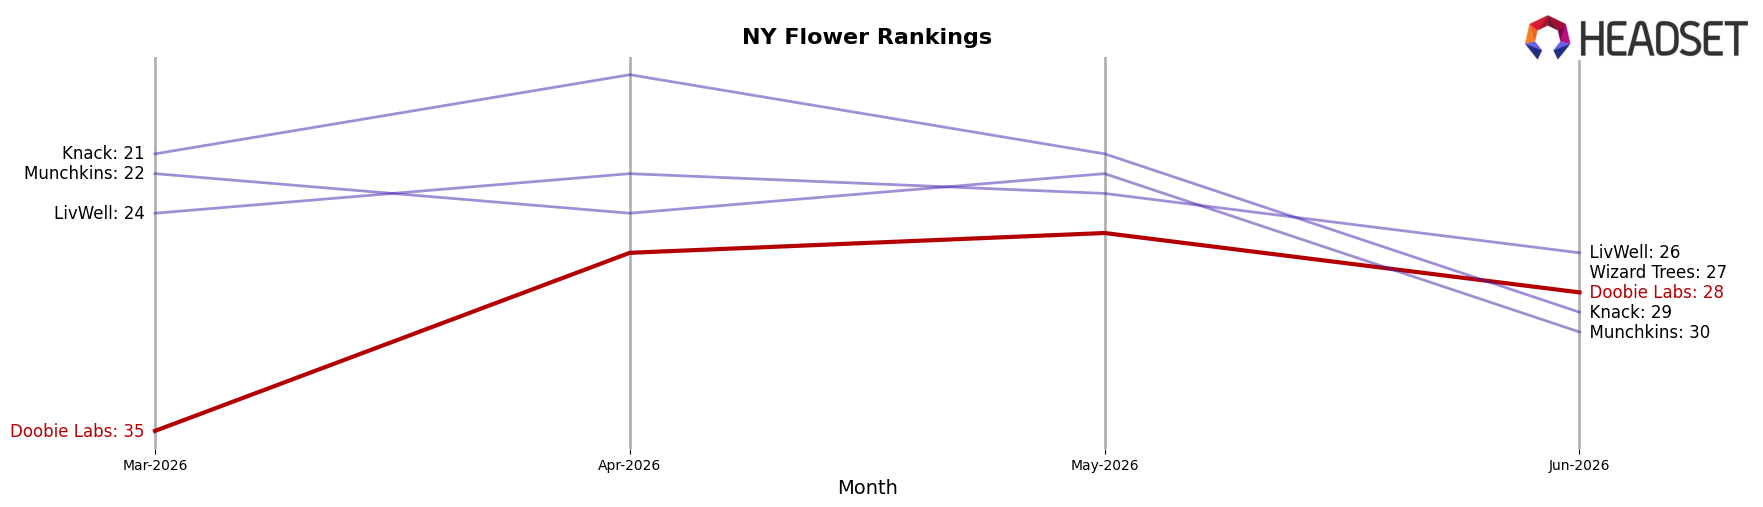
With Flower at rank 28 in New York and accounting for over two-thirds of sales, the double signal of 82.38% year-over-year growth and a 15.87% month-over-month contraction suggests regional shelf presence is improving annually while weekly turns softened in June. The 799.53% year-over-year surge in Vapor Pens coupled with a 22.77% month-over-month dip points to trial-driven expansion that lacks steadiness, and the 2.29% year-over-year decline in Pre-Roll against an 8.56% monthly slide indicates the format is not absorbing volatility from the other two categories. These shifts imply Doobie Labs is positioned as a Flower-first brand with emerging cross-category reach, but near-term share defense depends on stabilizing Vapor Pen repeat and moderating Flower volatility to sustain rank improvements in New York.
Competitive Landscape
Doobie Labs sits at rank #28 in June 2026, improving 11 positions from #39 year over year, while also rising 7 spots from #35 since March 2026; the brand’s prior peak at #20 in December 2025 marks an 8-rank gap to current placement. In contrast, Find. moved from #3 to #1 year over year with sales up 35.6%, and RYTHM advanced from #10 to #5 alongside a 40.6% sales increase, indicating upward mobility at the top even as Doobie Labs’ climb is mid‑tier; concurrently, Dank. By Definition slid from #1 to #3 with a 50.7% sales decline while Rolling Green Cannabis eased from #2 to #4 with a 7.1% drop, suggesting volatility among leaders. The pattern implies Doobie Labs is recovering share but not yet recapturing its December 2025 peak, so sustaining a mid‑single‑digit rank gain each quarter would be required to close the 8-position gap amid accelerating top-tier advances.
Notable Products
Northern Lights (3.5g) posted the steepest movement in June 2026, dropping 57.17% MoM to rank 8 while Blue Lobster (3.5g) fell 33.99% to rank 2, indicating a sharp reset at the top even as Blue Dream (3.5g) held rank 1 with a 9.51% decline. Venom Runtz (3.5g) rose 39.77% MoM at rank 5 while Push Pop (3.5g) slid 24.22% to rank 10, and two Pre-Roll packs moved in opposite directions with Blue Lobster Pre-Roll 5-Pack up 21.13% at rank 3 and Push Pop Pre-Roll 5-Pack down 19.52% at rank 7. Eight of the top ten are Flower SKUs, concentrating mix risk in a category where three SKUs declined by more than 12% MoM, and only one Flower gained more than 30% MoM. The pattern implies Doobie Labs is leaning on a Flower-heavy lineup that is fragmenting at the top, while Pre-Rolls provide a smaller but steadier ballast with fewer extreme swings and a clear upsell path from a $44,155 pack leader.
Top Selling Cannabis Brands
Data for this report comes from real-time sales reporting by participating cannabis retailers via their point-of-sale systems, which are linked up with Headset’s business intelligence software. Headset’s data is very reliable, as it comes digitally direct from our partner retailers. However, the potential does exist for misreporting in the instance of duplicates, incorrectly classified products, inaccurate entry of products into point-of-sale systems, or even simple human error at the point of purchase. Thus, there is a slight margin of error to consider. Brands listed on this page are ranked in the top twenty within the market and product category by total retail sales volume.

