.svg)
Sep-2026
Sales
Trend
6-Month
Product Count
SKUs
Avg Price
YoY Sales Change
YoY Price Change


Where to Buy
Dose is stocked at 153 licensed dispensaries across Washington, Oklahoma, and 3 other states, 93 of them in Washington, with the deepest coverage in Seattle, Everett, Tacoma, Anacortes, and Lynnwood. Search by ZIP code or city below to find the closest one, or filter by product type if you are after a specific format.
Market Insights Snapshot
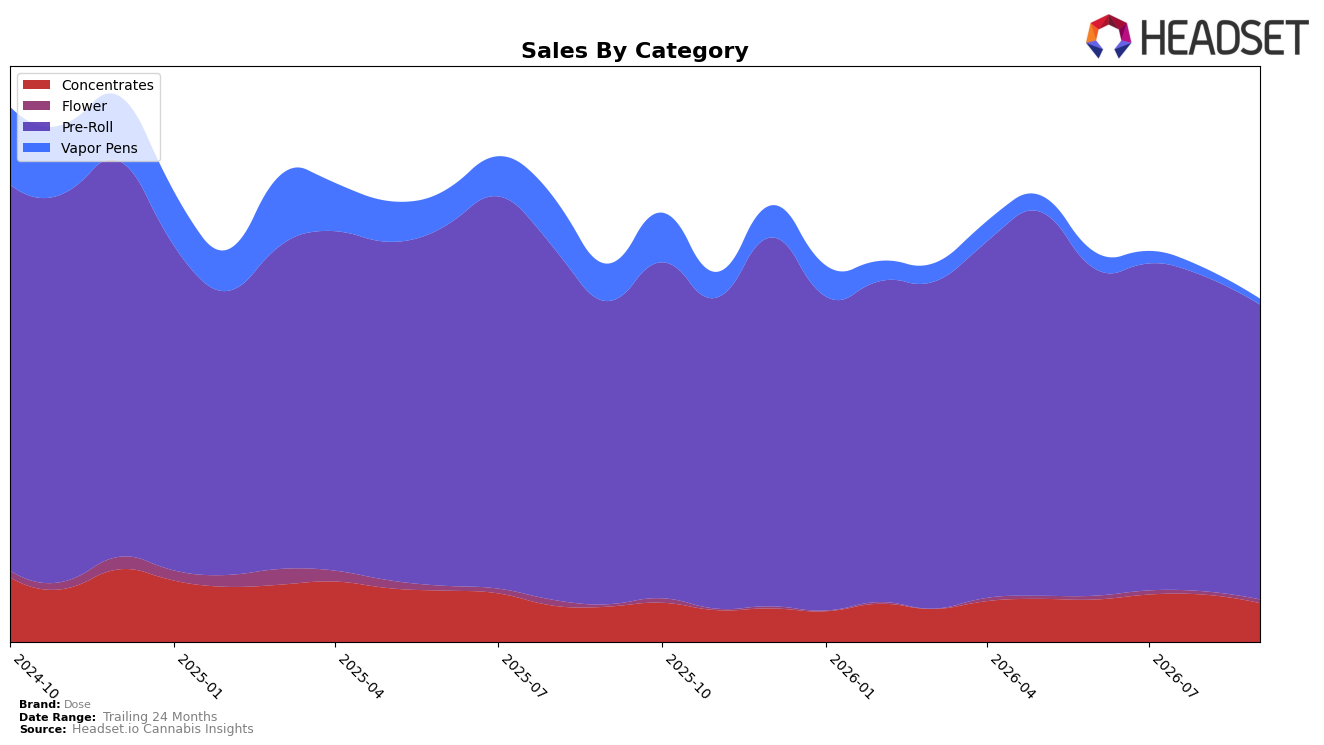
Dose’s mix in September 2026 is concentrated in Pre-Roll at 83.11% share with a year-over-year decline of 2.71% and a month-over-month drop of 6.31%, while Concentrates hold 11.95% share with a 8.69% year-over-year increase but a 16.48% month-over-month decline; Vapor Pens sit at 2.78% share with a 75.94% year-over-year contraction and a 19.58% month-over-month slide, and Flower at 2.17% share posted a 21.51% year-over-year rise and a 5.90% month-over-month gain. Against an overall brand sales change of -8.88% year-over-year and an average price shift of -2.30% year-over-year, the concentration in a down-trending Pre-Roll and the accelerating month-over-month pullback in Concentrates indicate the category mix is pulling total performance down even as niche gains in Flower provide only a small offset; the pattern implies Dose is overexposed to categories with negative momentum on a monthly basis.
With Pre-Roll dominance paired to a rank of 29 in Pre-Roll in Washington, the 6.31% month-over-month decline in that anchor category combined with a 19.58% month-over-month contraction in Vapor Pens points to a positioning skewed toward value-leaning, lower-price segments that are losing velocity, while the 21.51% year-over-year growth and 5.90% month-over-month growth in Flower suggest a small-but-expanding premium for format diversification. The mix shift, alongside -16.48% month-over-month pressure in Concentrates and an average price at $8.28, implies that sustaining share will require reallocating focus away from shrinking inhalable segments toward the growing Flower pocket or re-pricing and assortment pruning within Pre-Roll to defend rank and mitigate further loss.
Competitive Landscape
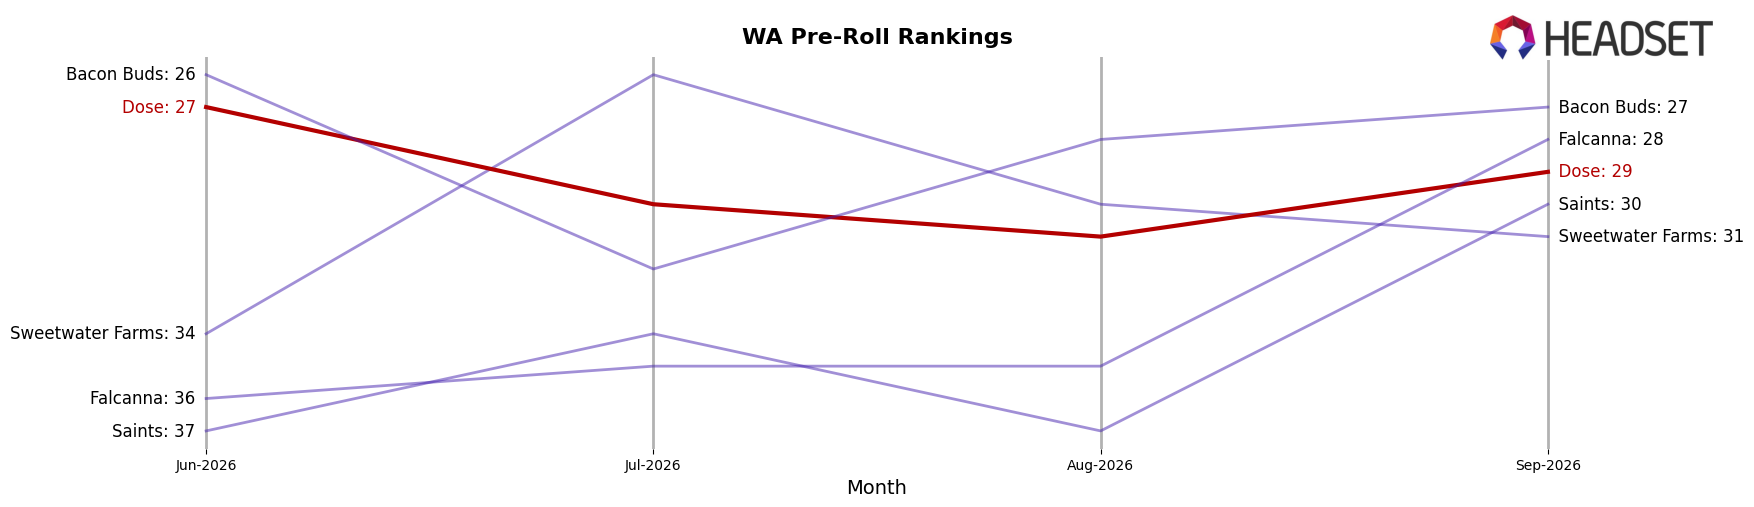
Dose sits at rank #29 in Washington Pre-Roll for September 2026, unchanged from #29 year over year, after slipping 2 positions from #27 in June 2026 and down 7 spots from its peak at #22 in February 2026; meanwhile, Ooowee holds #1 with a 57.7% year-over-year sales increase and Lifted Cannabis Co moved from #5 to #4 alongside a 16.4% YoY lift, indicating competitors are gaining positional momentum while Dose is static across the year and drifting quarter-over-quarter, which implies the brand’s rank trajectory is consolidating in the lower third unless mix, pricing, or distribution changes materially shift share.
Notable Products
Sour Diesel Infused Pre-Roll (1g) posted the steepest movement in September 2026 with a -28.9% month-over-month decline while holding rank 4, contrasting with Watermelon Gushers Infused Pre-Roll (1g) up 25.8% at rank 2 and Blueberry Muffins Infused Pre-Roll (1g) down 5.6% at rank 1. With four of the top ten concentrated in Pre-Roll SKUs that posted positive or stable positions around ranks 1–4 and 8, the mix points to a pivot toward flavor-led infused formats even as one legacy strain retrenches, implying Dose is leaning into breadth within a single format rather than chasing new categories.
Top Selling Cannabis Brands






Data for this report comes from real-time sales reporting by participating cannabis retailers via their point-of-sale systems, which are linked up with Headset’s business intelligence software. Headset’s data is very reliable, as it comes digitally direct from our partner retailers. However, the potential does exist for misreporting in the instance of duplicates, incorrectly classified products, inaccurate entry of products into point-of-sale systems, or even simple human error at the point of purchase. Thus, there is a slight margin of error to consider. Brands listed on this page are ranked in the top twenty within the market and product category by total retail sales volume.

