Jun-2026
Sales
Trend
6-Month
Product Count
SKUs
Avg Price
YoY Sales Change
YoY Price Change
Market Insights Snapshot
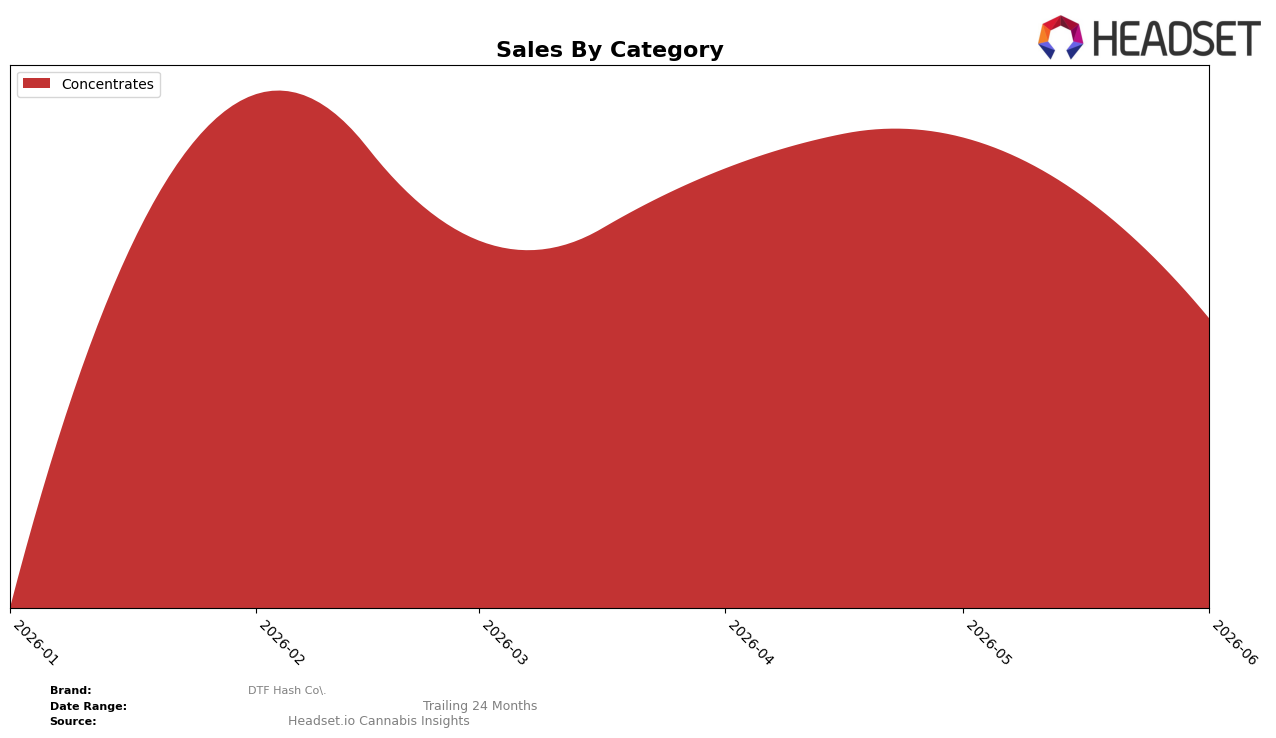
DTF Hash Co. operated as a single-category brand in June 2026, with Concentrates accounting for 100.0% of sales and a month-over-month decline of 37.4%. Within New York Concentrates, the brand’s rank sat at 29, indicating a lower-tier placement while pricing averaged $57.11 for the month. The pattern implies that a fully concentrated mix in Concentrates magnifies volatility, with a 37.4% MoM drop and a 29th rank combining to signal sensitivity to monthly demand swings and assortment constraints.
These shifts imply the brand’s positioning is tied almost entirely to the Concentrates demand cycle in New York, where a 100.0% category dependency and a 29th-place rank limit visibility and basket reach. With a 37.4% MoM contraction in its only category and average price at $57.11, the brand’s price-to-rank alignment suggests limited premium pull; the thesis is that without diversification or sharper subsegment targeting inside Concentrates, the brand’s exposure to monthly downturns remains elevated and upward mobility in rank is constrained.
Competitive Landscape
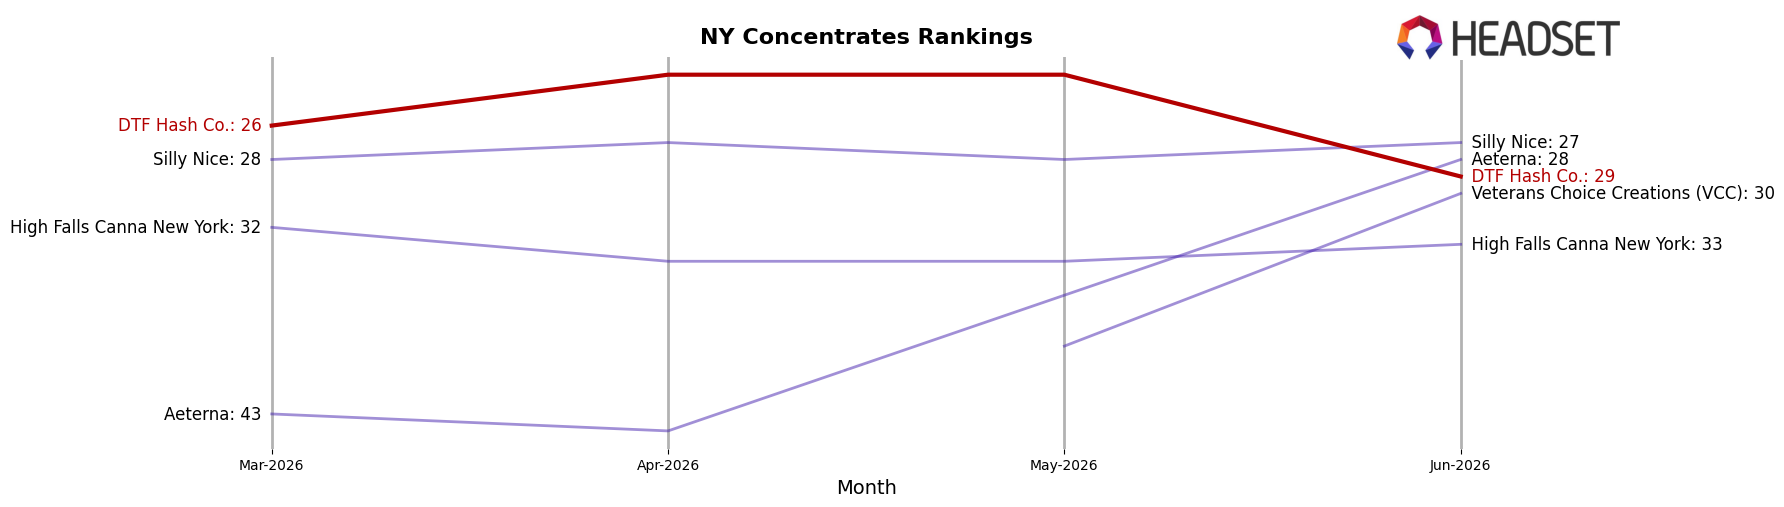
DTF Hash Co. sits at rank #29 in NY Concentrates in June 2026, down 3 positions from #26 in March 2026, and 9 spots below its peak of #20 in February 2026; with no year-over-year rank available, the current quarter-on-quarter slippage contrasts with UMAMII jumping from #26 to #3 year over year and Jetpacks rising from #4 to #2. While Mfny (Marijuana Farms New York) held #1 with a 70% year-over-year sales increase and RYTHM advanced from #7 to #4 alongside a 98% sales lift, DTF Hash Co.’s decline from #26 to #29 within a single quarter implies erosion in relative velocity and shelf presence unless the brand reclaims momentum seen at #20 in February 2026.
Notable Products
Mellow Kitty Live Rosin (1g) posted the steepest decline in June 2026 at -88.0% MoM while sitting at rank 8, and Cherry Larry Live Rosin (1g) fell even further at -93.5% MoM at rank 9, indicating deep tail volatility in the lineup. At the top, Super Boof Live Rosin (1g) held rank 1 despite a -41.0% MoM drop, and Sugar Cane Live Rosin (1g) at rank 2 slid -36.9% MoM, while Black Maple Live Rosin (1g) rose +47.5% MoM to rank 3 and GMO Pie Live Rosin (1g) climbed +47.7% MoM to rank 5; nine of the top ten are Concentrates. The pattern implies a portfolio leaning on a few premium Live Rosin leaders for rank stability while long-tail SKUs contract sharply, suggesting prioritization of high-velocity strains over breadth.
Top Selling Cannabis Brands
Data for this report comes from real-time sales reporting by participating cannabis retailers via their point-of-sale systems, which are linked up with Headset’s business intelligence software. Headset’s data is very reliable, as it comes digitally direct from our partner retailers. However, the potential does exist for misreporting in the instance of duplicates, incorrectly classified products, inaccurate entry of products into point-of-sale systems, or even simple human error at the point of purchase. Thus, there is a slight margin of error to consider. Brands listed on this page are ranked in the top twenty within the market and product category by total retail sales volume.

