May-2026
Sales
Trend
6-Month
Product Count
SKUs
Avg Price
YoY Sales Change
YoY Price Change
Market Insights Snapshot
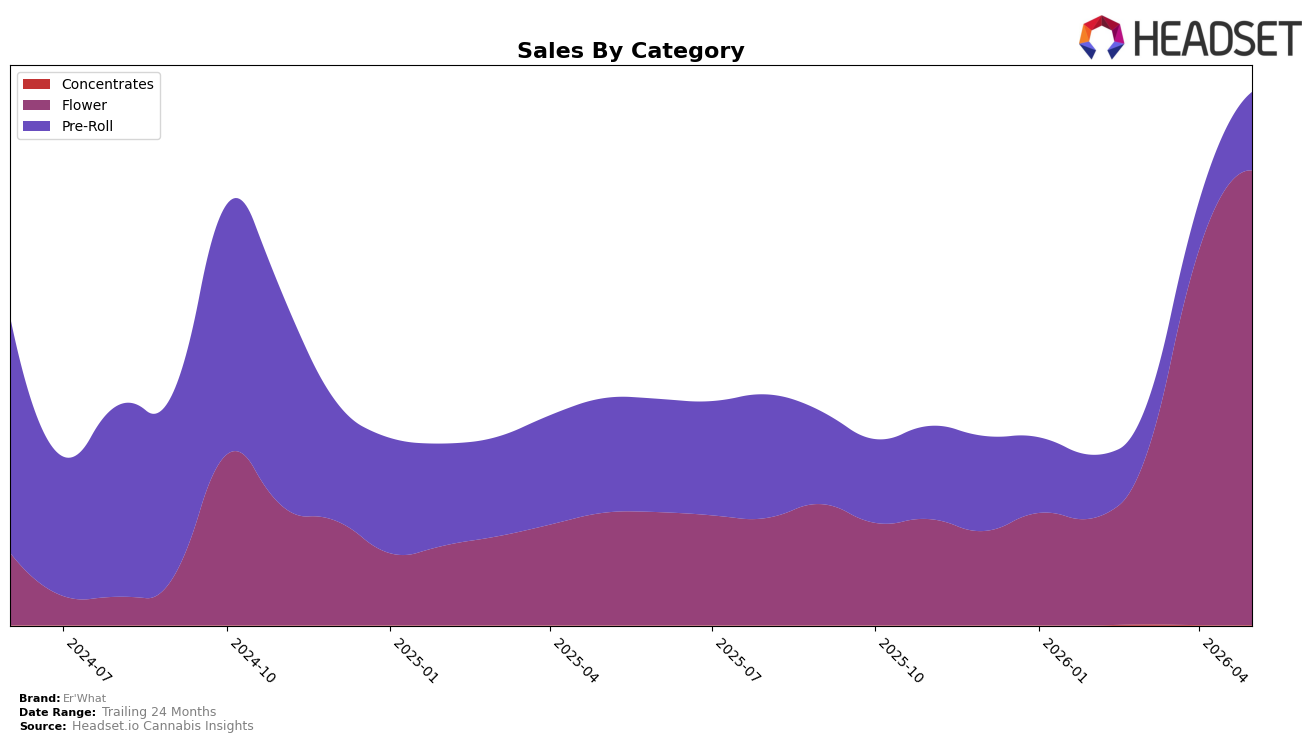
In May 2026, Er'What concentrated 85.29% of sales in Flower with a 305.26% year-over-year increase and a 21.55% month-over-month lift, while Pre-Roll held 14.67% share with a -31.59% year-over-year decline but a 61.95% month-over-month jump; Concentrates remained a 0.04% sliver with a -0.34% month-over-month move and no year-over-year baseline. The brand’s average price rose 27.78% year over year to $29.13 as Flower’s average price sat at 43.38 and Pre-Roll at 10.02, and Flower ranked 30 in Alberta Flower. The pattern implies an intentional tilt toward higher-priced Flower driving overall growth, with tactical re-engagement in Pre-Roll month over month without reversing its year-over-year contraction.
These shifts position Er'What as a Flower-led player where scale is concentrated in a single category that grew 305.26% year over year yet still sits at rank 30 in Alberta, while the 61.95% month-over-month Pre-Roll rebound against a -31.59% year-over-year base points to episodic activation rather than a structural mix change. With brand sales up 135.39% year over year and 343.05% over 24 months alongside a 27.78% average price increase, the mix skews toward premiumization in Flower and selective volume capture in value-tier Pre-Roll, implying headroom to climb from rank 30 if Flower momentum sustains while avoiding margin dilution from rapid Pre-Roll share gains.
Competitive Landscape
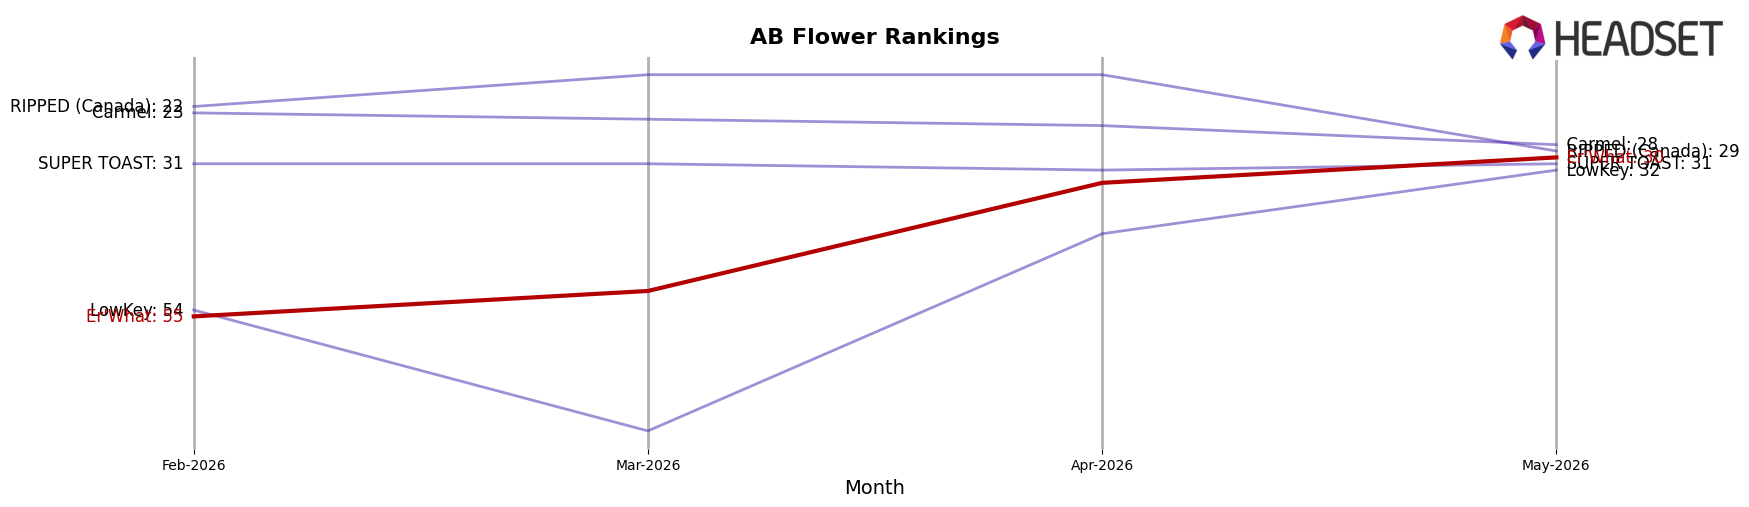
Er'What is ranked #30 in AB Flower in May 2026, improving 27 positions year over year from #57 and 25 spots since February 2026 when it sat at #55. Against leaders, Pure Sunfarms climbed from #5 to #1 with a 45.9% YoY sales increase, while Good Supply slipped from #1 to #2 alongside a 21.2% YoY sales decline, indicating that upward mobility is possible amid share rotations. Er'What also hit its peak rank to date at #30 in May 2026, a new high-water mark, while Back Forty / Back 40 Cannabis moved from #2 to #4 with a 33.6% YoY sales decrease, suggesting Er'What’s rank gains are tied to both its own ascent and competitor contraction; the trajectory implies Er'What is transitioning from fringe placement toward mid-tier relevance if it sustains multi-month rank compression.
Notable Products
Durban Poison Pre-Roll 2-Pack (2g) posted the standout move in May 2026 with +106.6% MoM to rank 1, while Strawberry Kush (3.5g) slipped -15.7% at rank 5. Blackberry Moonrocks Pre-Roll 2-Pack (2g) also cleared the +50% bar at +55.5% and ranked 2, and Z-OG (7g) advanced +74.4% to rank 8. With three Pre-Roll SKUs sitting in the top six and Flower spanning ranks 3 through 10, the mix points to a pivot toward value-led inhalables where scaled pack formats are accelerating trial and basket attachment.
Top Selling Cannabis Brands
Data for this report comes from real-time sales reporting by participating cannabis retailers via their point-of-sale systems, which are linked up with Headset’s business intelligence software. Headset’s data is very reliable, as it comes digitally direct from our partner retailers. However, the potential does exist for misreporting in the instance of duplicates, incorrectly classified products, inaccurate entry of products into point-of-sale systems, or even simple human error at the point of purchase. Thus, there is a slight margin of error to consider. Brands listed on this page are ranked in the top twenty within the market and product category by total retail sales volume.

