Jun-2026
Sales
Trend
6-Month
Product Count
SKUs
Avg Price
YoY Sales Change
YoY Price Change
Market Insights Snapshot
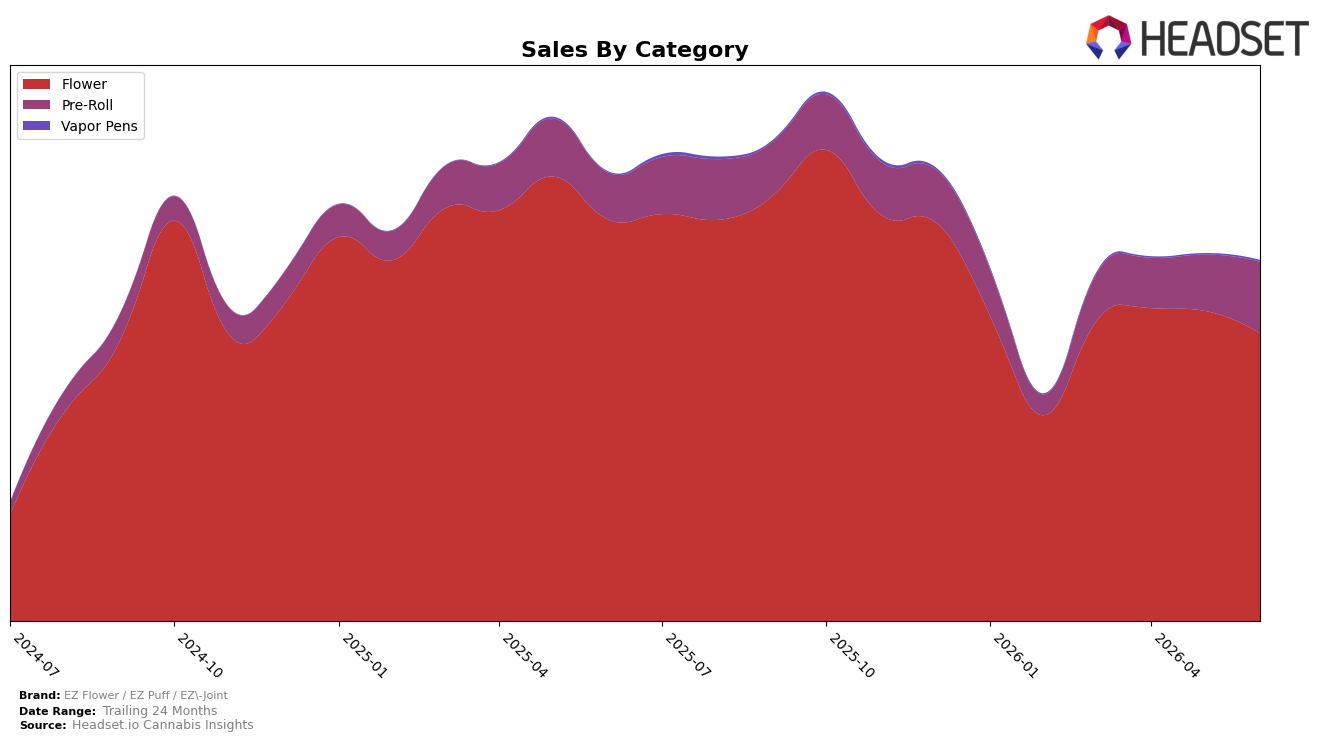
EZ Flower / EZ Puff / EZ-Joint concentrated 79.81% of June 2026 sales in Flower while Pre-Roll accounted for 19.79% and Vapor Pens held 0.41%, with Flower down 28.40% year over year and 7.27% month over month even as Pre-Roll grew 52.73% year over year and 27.59% month over month. Vapor Pens expanded 102.97% year over year and 31.57% month over month from a small base, while the brand’s overall average price declined 6.46% year over year to $12.85 and Flower pricing sat at $18.51, indicating a volume pivot toward lower-priced units in Pre-Roll despite the brand’s rank of 6 in Flower in Washington, implying a reliance on Flower that is being diluted by faster Pre-Roll gains.
The mix shift—Flower share falling toward 79.81% amid declines of 28.40% year over year and 7.27% month over month while Pre-Roll rises to 19.79% with 52.73% year-over-year and 27.59% month-over-month growth—suggests the brand’s pack-size and price architecture is migrating toward value-oriented Pre-Rolls that can sustain traffic even as Flower softens. With Vapor Pens at 0.41% share but growing 102.97% year over year and 31.57% month over month, and an overall 6.46% average price decrease, the positioning is tilting toward accessible entry points; maintaining the Flower rank of 6 in Washington will likely depend on defending Flower price-volume while leaning into Pre-Roll momentum as a hedge against category cyclicality.
Competitive Landscape
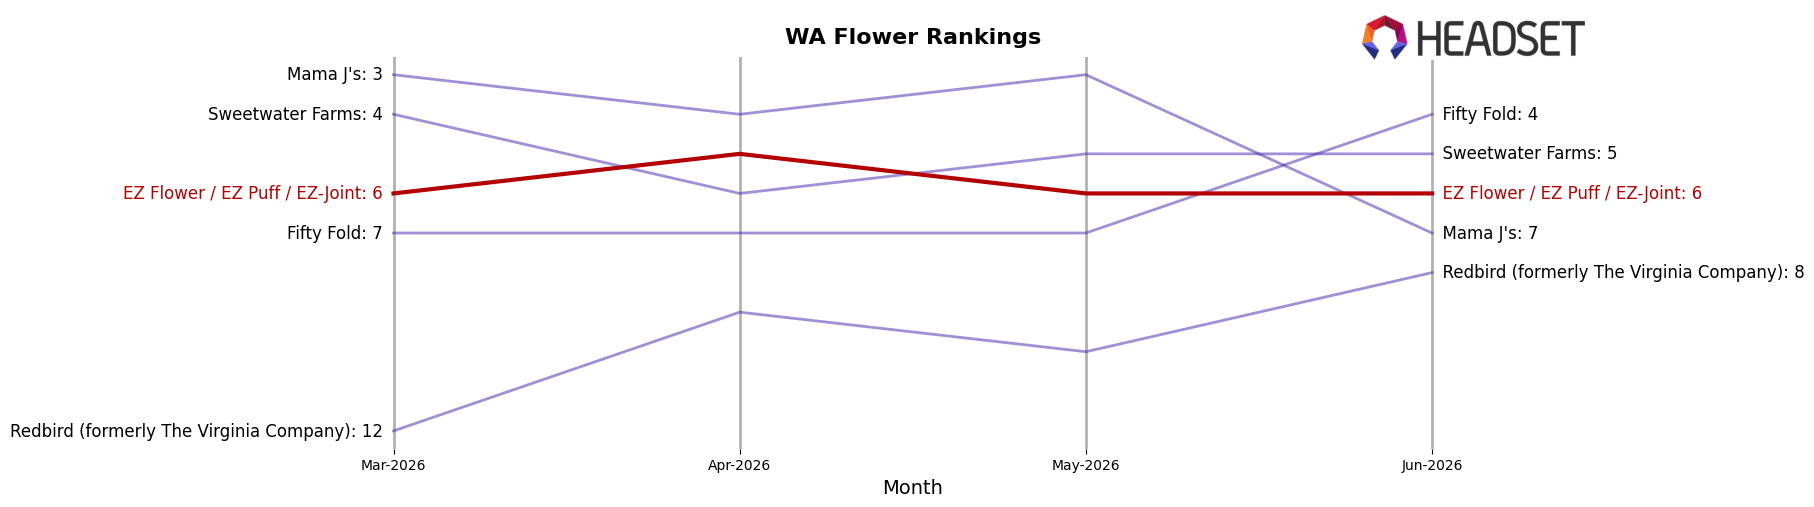
EZ Flower / EZ Puff / EZ-Joint sits at rank #6 in Washington Flower as of June 2026, down 3 positions year over year, and flat versus March 2026 at #6, which contrasts with a prior peak at #3 in September 2025. Competitive movement is tightening above it: Phat Panda held #1 with a 0-position YoY change while growing sales 16.6%, and Lifted Cannabis Co advanced from #8 to #3 alongside a 17.9% YoY sales gain; by comparison, Legends stayed at #2 despite a 19.8% YoY sales decline, and Sweetwater Farms climbed from #17 to #5 on 65.8% YoY growth. With two rivals moving up 5+ ranks while EZ Flower / EZ Puff / EZ-Joint slipped 3 ranks YoY and failed to regain its September 2025 #3 peak, the trajectory implies share is being redistributed upward to faster risers, requiring a catalyst to re-enter the top 5.
Notable Products
Georgia Pie (3.5g) set the tone by dropping 12.4% month over month while still holding rank 1, whereas Pineapple Express Infused Pre-Roll (1g) climbed 41.8% to rank 2, narrowing the gap and signaling a shift in momentum toward infused formats. Wedding Cake Infused Pre-Roll (1g) added 25.4% at rank 4 while Georgia Pie (7g) in Flower rose 6.6% at rank 7, and four of the top ten are Flower SKUs even as three infused pre-rolls sit in ranks 2, 3, and 4. Maui Wowie Infused Pre-Roll 2-Pack (1g) grew 17.4% at rank 3 alongside Raspberry Cough (3.5g) up 15.5% at rank 8, and Planet Sherb (3.5g) increased 7.1% at rank 9, pointing to breadth rather than a single-hero dependency. The pattern implies EZ Flower / EZ Puff / EZ-Joint is tilting assortment and demand toward higher-velocity infused pre-rolls while maintaining Flower as the volume base, suggesting mix management rather than price-led tactics despite Georgia Pie (3.5g) posting $23,985.
Top Selling Cannabis Brands
Data for this report comes from real-time sales reporting by participating cannabis retailers via their point-of-sale systems, which are linked up with Headset’s business intelligence software. Headset’s data is very reliable, as it comes digitally direct from our partner retailers. However, the potential does exist for misreporting in the instance of duplicates, incorrectly classified products, inaccurate entry of products into point-of-sale systems, or even simple human error at the point of purchase. Thus, there is a slight margin of error to consider. Brands listed on this page are ranked in the top twenty within the market and product category by total retail sales volume.

