Nov-2025
Sales
Trend
6-Month
Product Count
SKUs
Avg Price
YoY Sales Change
YoY Price Change
Market Insights Snapshot
Faded Cannabis Co. has shown varied performance across different categories and states. In the Oregon market, the brand's ranking in the Concentrates category has seen a slight decline over the months, moving from 19th in August 2025 to 26th by November 2025. This downward trend in rankings corresponds with a decrease in sales figures, indicating a potential area for the brand to focus on improving its market strategy. The fact that the brand remains within the top 30 suggests it still holds a significant market presence, but the continuous drop in ranking could be a cause for concern if the trend persists.
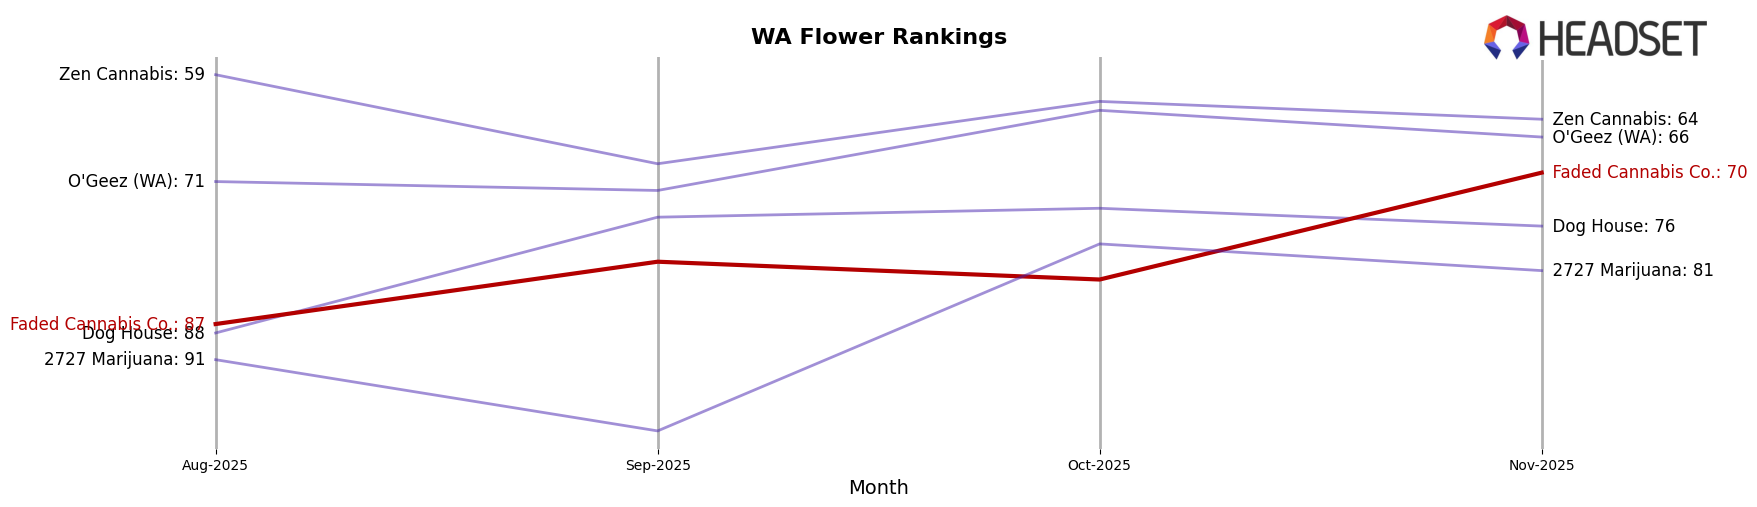
In contrast, the Washington market presents a different picture for Faded Cannabis Co. in the Flower category. Initially ranked 87th in August 2025, the brand has climbed to 70th by November 2025, demonstrating a positive trajectory. This upward movement in rankings is coupled with an increase in sales from October to November, suggesting a growing consumer base or improved product reception in this category. The brand's ability to improve its position in a competitive market like Washington highlights its potential for further growth, although it has yet to break into the top 30, which would be a significant milestone.
Competitive Landscape
In the competitive landscape of the flower category in Washington, Faded Cannabis Co. has shown a notable improvement in rank from August to November 2025, moving from 87th to 70th place. This upward trend in rank is significant, especially when compared to competitors such as Dog House, which has remained relatively stable, fluctuating slightly between 74th and 76th place. Meanwhile, 2727 Marijuana has seen more volatility, with ranks ranging from 78th to 99th, indicating a less consistent performance. Zen Cannabis and O'Geez (WA) have maintained stronger positions, consistently ranking higher than Faded Cannabis Co., with Zen Cannabis peaking at 59th in August and O'Geez (WA) reaching 63rd in October. Despite these challenges, Faded Cannabis Co.'s sales have shown a promising increase in November, suggesting a positive reception in the market and potential for further growth if the trend continues.
Notable Products
In November 2025, Captain Kush (Bulk) emerged as the top-performing product for Faded Cannabis Co., achieving the number one rank with sales of 4803 units. Grape Pop (Bulk) followed closely as the second top-selling product, marking a significant rise from its fifth position in September to second in November. GMO (Bulk), which held the top rank in both September and October, dropped to third place in November, indicating a decline in its sales momentum. Meanwhile, Double Cake Mix Cured Resin (2g) made its debut in the rankings at fourth place, showcasing strong performance in the Concentrates category. Permanent Marker (Bulk) entered the list in fifth place, highlighting a new contender in the Flower category for the month.
Top Selling Cannabis Brands
Data for this report comes from real-time sales reporting by participating cannabis retailers via their point-of-sale systems, which are linked up with Headset’s business intelligence software. Headset’s data is very reliable, as it comes digitally direct from our partner retailers. However, the potential does exist for misreporting in the instance of duplicates, incorrectly classified products, inaccurate entry of products into point-of-sale systems, or even simple human error at the point of purchase. Thus, there is a slight margin of error to consider. Brands listed on this page are ranked in the top twenty within the market and product category by total retail sales volume.

