.svg)


Market Insights Snapshot
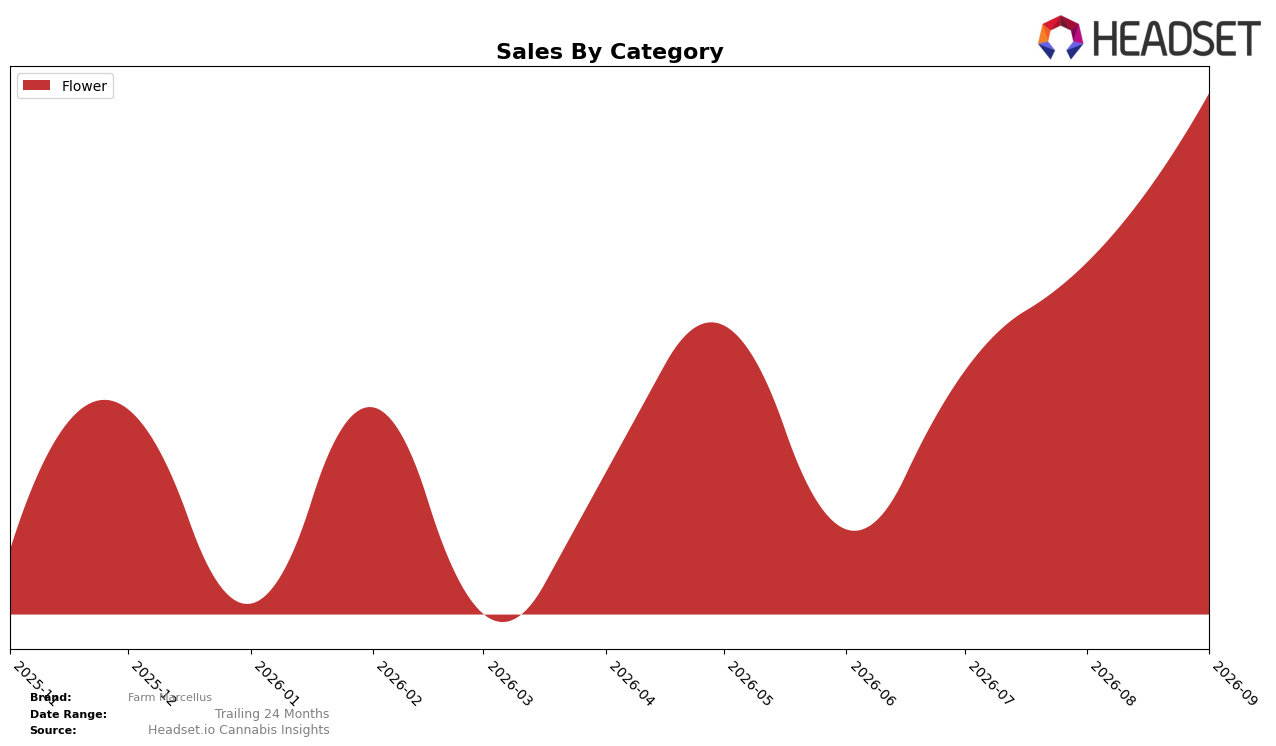
Farm Marcellus concentrated entirely in Flower at 100.0% category share in September 2026, with month-over-month sales up 38.25% while average price sat at $27.10. Within the Michigan Flower context, the brand held rank 36, indicating a middle-of-pack position alongside a sizable MoM lift; the absence of year-over-year figures contrasts with a clear September acceleration. The pattern implies Farm Marcellus is leaning into a single-category strategy where volume growth outpaced any diversification, positioning the brand to trade ranking gains for depth in Flower rather than breadth across segments.
Holding 100.0% in Flower while posting a 38.25% MoM increase suggests Farm Marcellus is competing on velocity rather than portfolio spread, and rank 36 in Michigan Flower signals room to trade share through targeted pricing around the $27.10 level versus mix expansion. With no year-over-year benchmark and no other categories contributing share, the brand’s positioning hinges on sustaining sequential Flower momentum and converting it into rank movement, implying that short-term gains may be more sensitive to price and strain availability than to cross-category resilience.
Competitive Landscape
Farm Marcellus sits at rank #36 in MI Flower with no year-over-year rank available, rising 82 positions from #118 in June 2026 to a peak of #36 in September 2026, while top-tier competitors set the pace: High Minded holds #1 despite a 3.3% YoY sales decline, and Play Cannabis moved to #2 with a 33.3% YoY sales increase and a 7-rank climb; further up the leaderboard, Pro Gro advanced 6 ranks to #3 with 25.5% YoY growth while NOBO jumped 19 ranks to #4 on 188.3% YoY growth. The combination of Farm Marcellus’s 82-rank quarterly surge and competitors’ double-digit gains indicates the brand’s recent momentum is building from a lower base and implies that sustaining share will require continued step-changes in distribution or assortment to close the gap with entrenched leaders.

Notable Products
Cherry Oreoz (Bulk) posted the standout surge in September 2026 with +1613% month over month and a jump into rank 5, while Rainbow Belts x Gelato 41 (Bulk) also spiked +120% MoM to rank 6. At the top, Detroit Runtz (Bulk) held rank 1 with +11% MoM as Gelato 41 x Donnie Burger (Bulk) climbed +16% MoM to rank 3. With all top-10 items in Flower and multiple Runtz and Gelato crosses concentrated in the top six, the mix points to a pivot toward fast-scaling hybrids that can be repeated across genetics rather than single-SKU bets.
Top Selling Cannabis Brands






Data for this report comes from real-time sales reporting by participating cannabis retailers via their point-of-sale systems, which are linked up with Headset’s business intelligence software. Headset’s data is very reliable, as it comes digitally direct from our partner retailers. However, the potential does exist for misreporting in the instance of duplicates, incorrectly classified products, inaccurate entry of products into point-of-sale systems, or even simple human error at the point of purchase. Thus, there is a slight margin of error to consider. Brands listed on this page are ranked in the top twenty within the market and product category by total retail sales volume.

