Jun-2026
Sales
Trend
6-Month
Product Count
SKUs
Avg Price
YoY Sales Change
YoY Price Change
Market Insights Snapshot
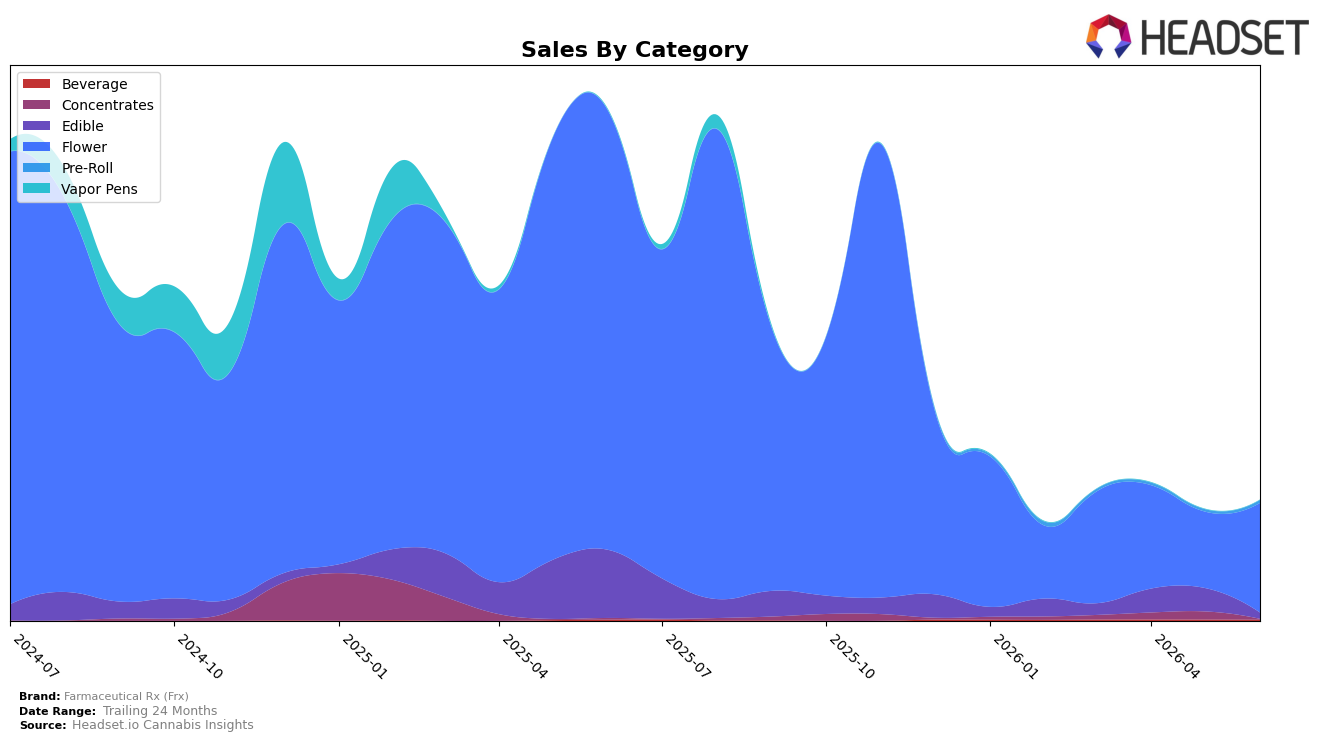
Farmaceutical Rx (Frx) concentrated 91.62% of June 2026 sales in Flower, where sales rose 43.65% month over month despite a 75.11% year-over-year drop, while Edible shrank to 4.91% share with a 74.58% MoM decline and a 91.36% YoY fall. Pre-Roll expanded to 2.16% share with 28.19% MoM growth (YoY not available), contrasting with Beverage at 0.93% share posting a 13.03% MoM decline and a 5.54% YoY decrease; Concentrates fell to 0.38% share with a 94.07% MoM contraction and a 64.00% YoY decline. With average price down 8.19% YoY to $34.39 and top-market concentration in Ohio, the mix implies a tactical pivot toward volume recovery in Flower while higher-priced or niche formats compress, pointing to reliance on a single anchor category amid broad YoY retrenchment.
By leaning into Flower momentum (+43.65% MoM) while ceding share and volume in Edible (-74.58% MoM) and Concentrates (-94.07% MoM), Farmaceutical Rx (Frx) is positioning as a price-flexible Flower-first player where a lower YoY average price (-8.19%) is used to restore throughput. The 44 rank in Flower in Ohio alongside Pre-Roll’s 28.19% MoM lift suggests adjacency building around inhalables, but the simultaneous 5.54% YoY decline in Beverage and deep YoY contraction in Edible (-91.36%) indicate limited pull in non-inhalable formats; this pattern implies near-term share defense will depend on sustaining Flower price-pack architecture while selectively nurturing Pre-Roll to diversify without diluting the core.
Competitive Landscape
Farmaceutical Rx (Frx) sits at rank #44 in OH Flower in June 2026, sliding 21 positions year over year from #23 and holding flat versus March 2026 at #44, while the brand’s historical peak was #13 in July 2024. Competitive pressure intensified as Klutch Cannabis climbed from #20 to #1 with 304.8% year-over-year sales growth and RYTHM rose from #6 to #3 with 67.7% growth, whereas Riviera Creek slipped from #1 to #2 with a 22.7% decline. The combination of a 21-rank YoY drop and two rivals moving up 17 and 3 ranks implies Farmaceutical Rx (Frx) is losing relative shelf position to faster-advancing leaders, and the flat three-month rank signals limited near-term momentum unless assortment or pricing shifts.

Notable Products
With no month-over-month percentages supplied for June 2026, the headline is concentration: five of the top ten are Flower Minis or Smalls formats, anchored by GMO Minis (5.66g) at rank 1 and Ghost OG Smalls (5.66g) at rank 2, indicating small-format Flower is carrying the lineup while larger sizes lag at rank 7 and rank 10. The only non-Flower appearance in the top eight is Cherry Cola Elixir (50mg, 12oz, 355ml) at rank 8 with $1,500, while the lone Pre-Roll, Animal Face Pre-Roll 5-Pack (2.5g), sits at rank 6, implying limited cross-format pull relative to Minis-led Flower. The skew toward compact Flower packs at ranks 1, 2, and 3, alongside a 28.3g Flower at rank 7, implies Farmaceutical Rx (Frx) is winning on trial-priced or value-per-session formats rather than bulk, signaling a product strategy geared to frequent, smaller-basket purchases over volume buys.
Top Selling Cannabis Brands
Data for this report comes from real-time sales reporting by participating cannabis retailers via their point-of-sale systems, which are linked up with Headset’s business intelligence software. Headset’s data is very reliable, as it comes digitally direct from our partner retailers. However, the potential does exist for misreporting in the instance of duplicates, incorrectly classified products, inaccurate entry of products into point-of-sale systems, or even simple human error at the point of purchase. Thus, there is a slight margin of error to consider. Brands listed on this page are ranked in the top twenty within the market and product category by total retail sales volume.

