May-2026
Sales
Trend
6-Month
Product Count
SKUs
Avg Price
YoY Sales Change
YoY Price Change
Market Insights Snapshot
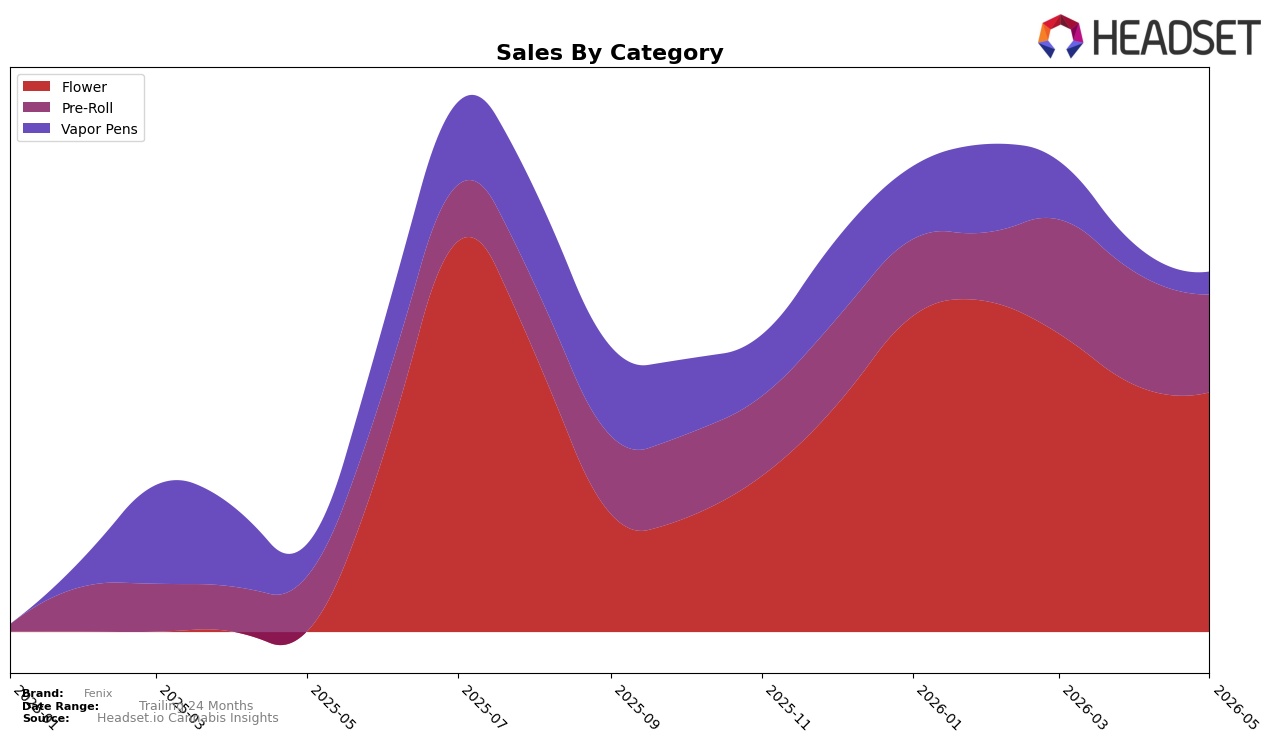
Fenix’s mix in May 2026 concentrated 66.59% of sales in Flower (ranked 8 in Arizona) with a month-over-month decline of 2.89%, while Pre-Roll held 27.13% share with 78.34% year-over-year growth but a 13.39% month-over-month drop; Vapor Pens accounted for 6.28% share with a 29.57% year-over-year decline and a 16.69% month-over-month decline. Despite brand-level sales up 314.44% year over year and average price up 63.82%, the simultaneous month-over-month pullbacks in Pre-Roll (down 13.39%) and Vapor Pens (down 16.69%) alongside Flower’s smaller dip (down 2.89%) imply that May’s growth narrative is driven by prior-period gains and pricing, while current-period demand is tilting back toward core Flower rather than breadth expansion.
The category shifts point to a positioning anchored in mid- to higher-ticket inhalables: Flower’s 66.59% share at an average price of $21.60 versus Pre-Roll’s 27.13% share at $3.73 and Vapor Pens’ 6.28% at $25.45 suggests Fenix is leaning on Flower elasticity more than Vapor Pen premiumization, as evidenced by the 16.69% month-over-month decline in Vapor Pens and the 2.89% decline in Flower. With Flower ranked 8 in Arizona and Pre-Roll showing 78.34% year-over-year growth but contracting 13.39% month over month, the mix signals an opportunity: defend Flower share for baseline velocity while recalibrating Pre-Roll assortment to convert its year-over-year momentum into steadier month-over-month contribution, implying near-term focus on depth within Flower and margin-aware bundles to stabilize the more volatile Pre-Roll and Vapor Pen lines.
Competitive Landscape
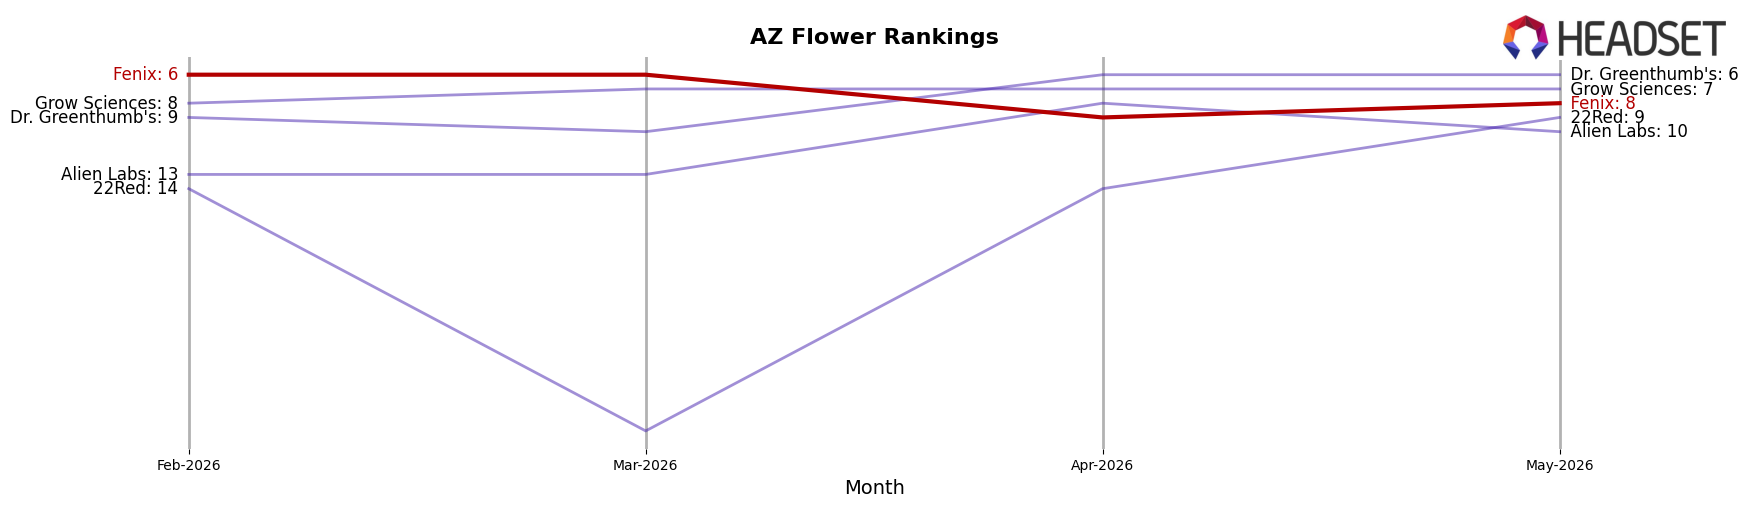
Fenix is ranked #8 in AZ Flower in May 2026, down 2 positions from #6 in February 2026, and trailing its peak of #4 from August 2025; by contrast, JustFLOWR (MA) holds #1 while its sales fell 37.4% year over year, and Just Flower / Just Vape surged to #4 with a 51-place YoY rank gain alongside a 2,749.9% YoY sales increase. Additional pressure comes from Find. at #2 with a 2-place YoY rank, and Brown Bag at #5 with a 14-place YoY improvement and 142.9% YoY sales growth; Fenix’s current #8 versus #6 three months ago indicates slippage against faster-moving peers, implying that without a share-accretive move, its rank trajectory points toward mid-tier stagnation rather than re-approach to its #4 peak.
Notable Products
Apple Strudel Pre-Roll (1g) posted the steepest movement in May 2026 with a -19.3% month-over-month drop, sliding to rank 3 while Rainbow BTZ Pre-Roll (1g) rose 21.2% to hold rank 1. Pineapple Donut Pre-Roll (1g) advanced 47.8% MoM to rank 2, and with four of the top ten coming from the Pre-Roll family, mix is tilting toward quick-turn formats even as one flagship retrenches. Meanwhile, Brain Stain (14g) fell 27.0% MoM at rank 10 despite a sizable $140,304 in sales, contrasting with Jamaica Kush (14g) at rank 7 and signaling that large-format Flower is fragmenting by strain rather than size. Taken together, expanding momentum at the top of Pre-Roll alongside divergence within 14g Flower implies Fenix is concentrating demand into a few winner SKUs while pruning underperforming large-format variants.
Top Selling Cannabis Brands
Data for this report comes from real-time sales reporting by participating cannabis retailers via their point-of-sale systems, which are linked up with Headset’s business intelligence software. Headset’s data is very reliable, as it comes digitally direct from our partner retailers. However, the potential does exist for misreporting in the instance of duplicates, incorrectly classified products, inaccurate entry of products into point-of-sale systems, or even simple human error at the point of purchase. Thus, there is a slight margin of error to consider. Brands listed on this page are ranked in the top twenty within the market and product category by total retail sales volume.

