Jun-2026
Sales
Trend
6-Month
Product Count
SKUs
Avg Price
YoY Sales Change
YoY Price Change
Market Insights Snapshot
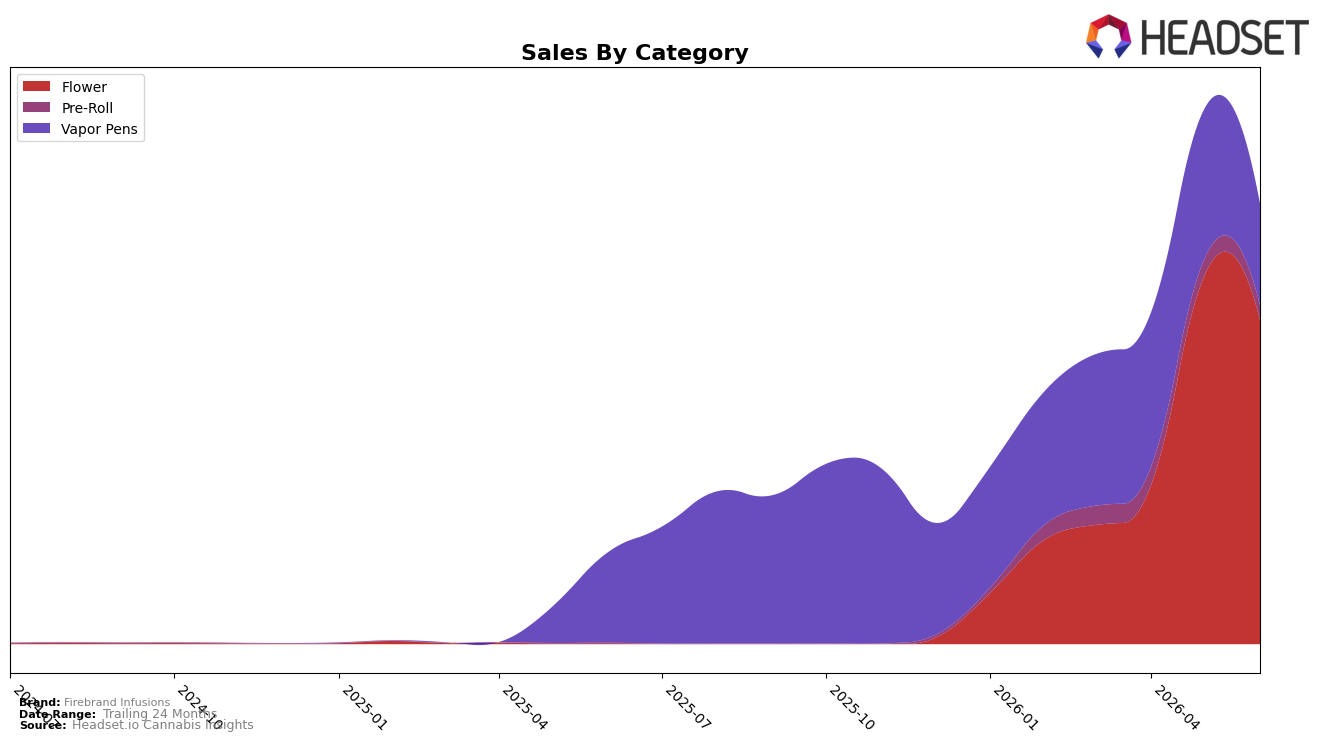
In June 2026, Firebrand Infusions concentrated 73.65% of sales in Flower with a year-over-year change of 47,461.19% alongside a month-over-month decline of 12.18%, while Vapor Pens held 23.01% share with an 11.85% year-over-year increase and a 32.43% month-over-month drop. Pre-Roll contributed 3.35% share with an 11.25% month-over-month decline and no year-over-year baseline, and the brand’s average price rose 56.47% year-over-year to $31.28 even as Flower’s average price sat at $39.19, indicating mix-driven price stratification. This combination of a rank of 24 in Flower in Ohio and a simultaneous contraction in monthly Flower and Vapor Pens suggests the brand is over-indexed in a volatile lead category while experiencing short-term pullback, implying that June 2026 marked a consolidation phase rather than expansion across formats.
The surge in Flower’s year-over-year base paired with a 12.18% month-over-month dip, plus Vapor Pens falling 32.43% month-over-month while rising 11.85% year-over-year, implies outsized dependence on a single growth engine and sensitivity to monthly demand shifts; the 73.65% share concentration and a rank position of 24 in Flower in Ohio point to scale without top-tier defensibility. With Pre-Roll at just 3.35% share and an 11.25% month-over-month decline, the portfolio’s narrow spread and a 56.47% year-over-year price lift indicate a laddering-up strategy that can support revenue per unit but may constrain trial in softer months, implying that sustained positioning will require either deeper Flower differentiation or deliberate rebalancing toward steadier secondary formats.
Competitive Landscape
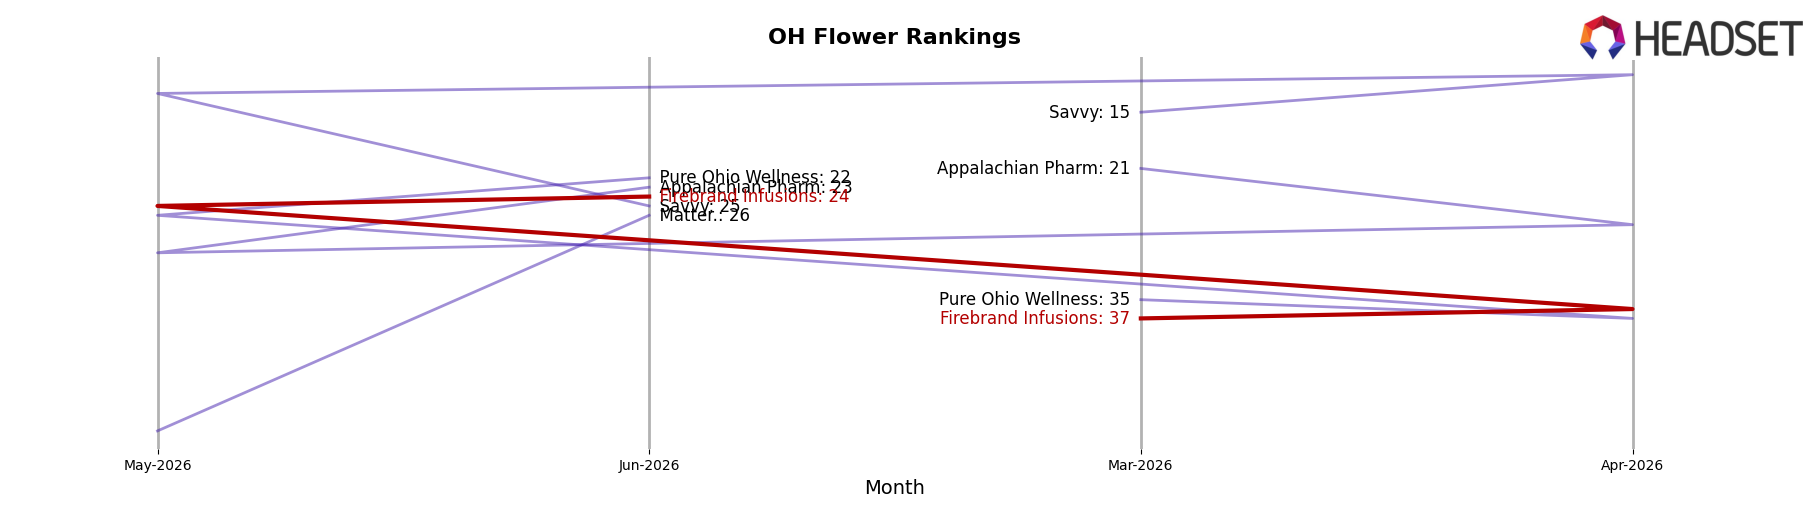
Firebrand Infusions sits at rank #24 in OH Flower in June 2026 after climbing 52 spots year over year from #76 to #24, and it improved 13 positions quarter-over-quarter from #37 in March 2026 to #24 in June 2026; meanwhile, peak rank matched current at #24 in June 2026, indicating recent momentum, while Klutch Cannabis advanced from #20 to #1 and RYTHM moved from #6 to #3 as Riviera Creek slipped from #1 to #2 with a 22.7% sales decline. This rank trajectory implies Firebrand Infusions is transitioning from tail-end visibility toward mid-pack relevance, but share consolidation at the top suggests further gains will require outpacing leaders that are accelerating faster.
Notable Products
Durban Poison Distillate Cartridge (1g) posted the steepest decline in June 2026 at -42.6% MoM while sliding to rank 8, and GG4 Distillate Cartridge (1g) fell -40.6% MoM at rank 10, signaling a compression in lower-tier Vapor Pens. Northern Lights Distillate Cartridge (1g) also contracted -16.3% MoM at rank 2 as Blueberry Banana Pancakes Distillate Cartridge (1g) dropped -23.9% MoM at rank 4, with six of the top ten coming from the Vapor Pens family that is losing momentum relative to Flower. Dynamite Diesel (3.5g) held rank 1 and Monster Cookies (14.15g) sat at rank 5 with a combined $172,315, indicating Flower is carrying mix stability while pen SKUs retrench. The pattern implies Firebrand Infusions is pivoting toward higher-ranked Flower to buffer volatility in Vapor Pens, concentrating assortment where rank resilience offsets sharp MoM declines.
Top Selling Cannabis Brands
Data for this report comes from real-time sales reporting by participating cannabis retailers via their point-of-sale systems, which are linked up with Headset’s business intelligence software. Headset’s data is very reliable, as it comes digitally direct from our partner retailers. However, the potential does exist for misreporting in the instance of duplicates, incorrectly classified products, inaccurate entry of products into point-of-sale systems, or even simple human error at the point of purchase. Thus, there is a slight margin of error to consider. Brands listed on this page are ranked in the top twenty within the market and product category by total retail sales volume.

