.svg)

Sep-2026
Sales
Trend
6-Month
Product Count
SKUs
Avg Price
YoY Sales Change
YoY Price Change


Where to Buy
King City Gardens is stocked at 90 licensed dispensaries across Ohio, with the deepest coverage in Columbus, Cleveland, Cincinnati, Athens, and Dayton. Search by ZIP code or city below to find the closest one, or filter by product type if you are after a specific format.
Market Insights Snapshot
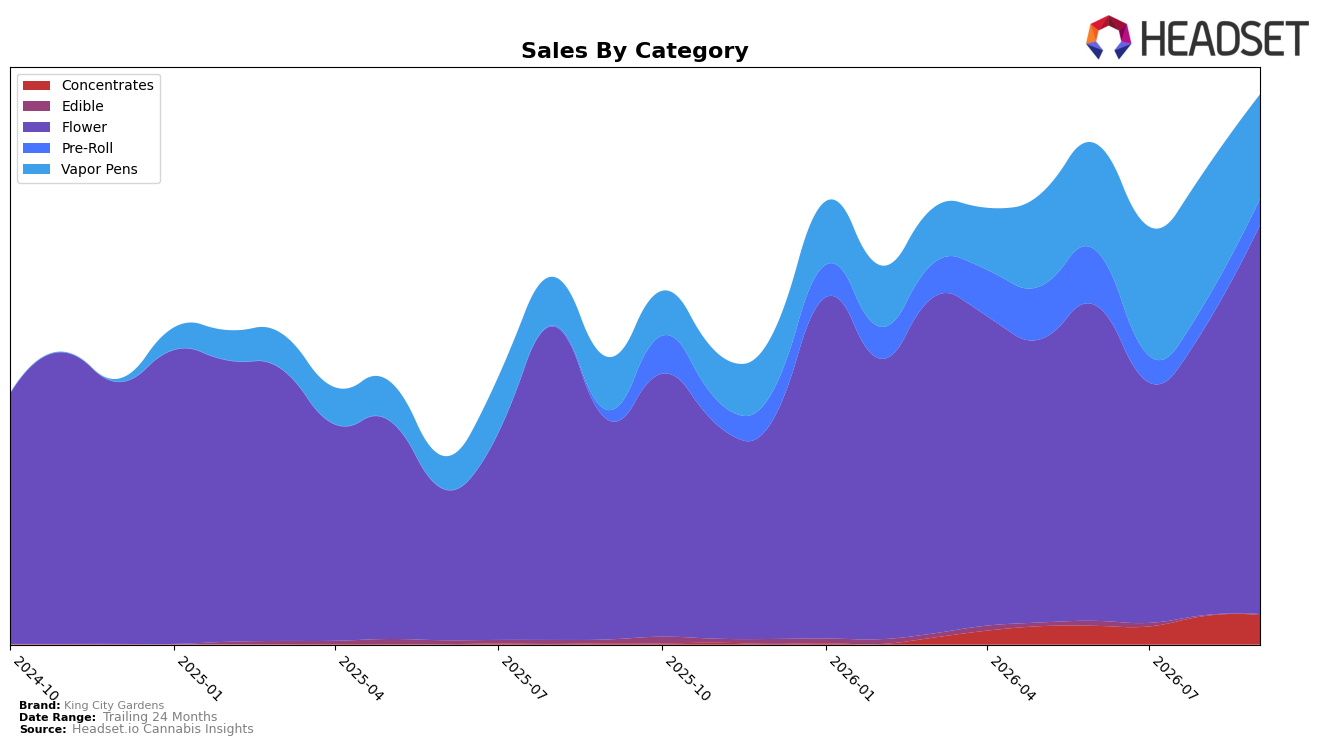
King City Gardens concentrated 70.83% of September 2026 sales in Flower, up 35.42% month over month and 77.45% year over year, while Vapor Pens held 19.00% share but fell 21.20% month over month despite a 97.74% year-over-year lift. Concentrates expanded to 5.33% share with a 3.46% month-over-month gain and a 2,616.78% year-over-year surge, and Pre-Roll reached 4.71% share with 7.17% month-over-month and 169.18% year-over-year growth; Edible slipped to 0.12% share even as it rose 18.92% month over month and declined 80.60% year over year. With a rank of 2 in Flower in Ohio and a 19.53% year-over-year increase in average price to $30.57, the category mix signals a pivot toward higher-velocity inhalables where price elasticity is currently favorable.
The shift toward Flower dominance alongside a pullback in Vapor Pens month over month indicates portfolio prioritization of fast-turn SKUs that reinforce Flower leadership at rank 2 in Ohio, while the outsized year-over-year expansion in Concentrates (2,616.78%) and Pre-Roll (169.18%) points to emerging adjacency depth that can buffer seasonal volatility. The contrast between Vapor Pens’ 97.74% year-over-year rise and 21.20% month-over-month decline, coupled with Flower’s simultaneous 35.42% month-over-month lift, implies near-term resource allocation should favor Flower and targeted Concentrates/Pre-Roll expansion to sustain the 91.93% brand-level year-over-year growth, using Edible’s 80.60% year-over-year contraction as a cue to limit optionality where demand density is thin.
Competitive Landscape
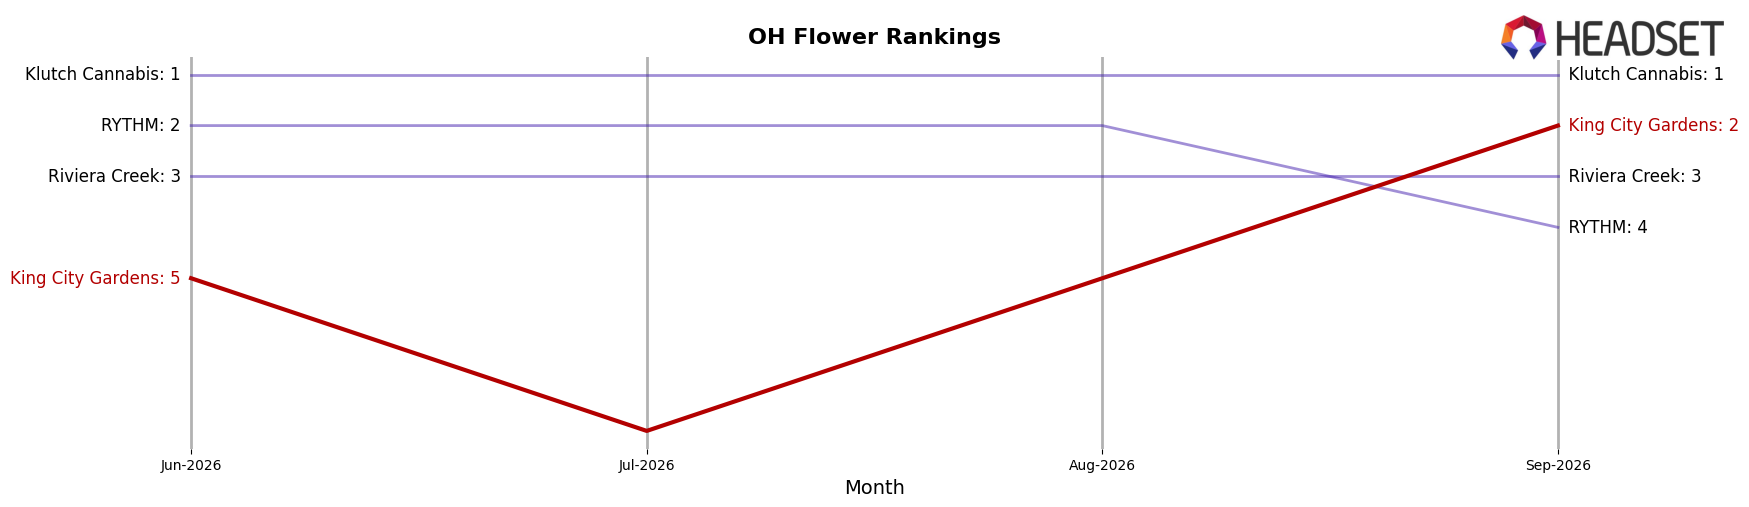
King City Gardens sits at rank #2 in OH Flower in September 2026 after climbing 8 places year over year from #10, and moving 3 positions in three months from #5 to #2; this marks a new peak rank of #2 in September 2026 while closing the gap against Klutch Cannabis, which rose from #13 to #1 with 162.4% YoY sales growth, and widening separation from Riviera Creek at #3 with a slip from #2 and a -1.7% YoY sales change. Against mid-pack pressure, King City Gardens’ ascent contrasts with RYTHM drifting from #7 to #4 (+3 ranks) and Northwoods Cannabis rocketing from #76 to #5 on 105,837.8% YoY sales growth, indicating King City Gardens’ current trajectory is upward but at risk of compression from both the top-ranked leader and a fast-charging challenger, implying near-term share defense will hinge on sustaining rank gains beyond the recent 3-position quarterly climb.
Notable Products
Motorbreath #15 Smalls (3.5g) posted the largest month-over-month gain at +60.99% while moving up to rank 2, whereas Dulce De Uva (3.5g) fell -31.46% and slid to rank 10. Cream Smoothie Smalls (3.5g) advanced +19.02% yet remained mid-pack at rank 5, and Donkey OG Smalls (3.5g) declined -5.87% at rank 6. With nine of the top ten anchored in Flower and Smalls formats occupying ranks 1 through 7, the mix points to a strategy concentrating volume in value-oriented 3.5g Flower, using selective MoM surges to defend premium adjacency rather than diversifying into Pre-Roll despite a single entry at rank 8.
Top Selling Cannabis Brands






Data for this report comes from real-time sales reporting by participating cannabis retailers via their point-of-sale systems, which are linked up with Headset’s business intelligence software. Headset’s data is very reliable, as it comes digitally direct from our partner retailers. However, the potential does exist for misreporting in the instance of duplicates, incorrectly classified products, inaccurate entry of products into point-of-sale systems, or even simple human error at the point of purchase. Thus, there is a slight margin of error to consider. Brands listed on this page are ranked in the top twenty within the market and product category by total retail sales volume.

