.svg)

Sep-2026
Sales
Trend
6-Month
Product Count
SKUs
Avg Price
YoY Sales Change
YoY Price Change


Market Insights Snapshot
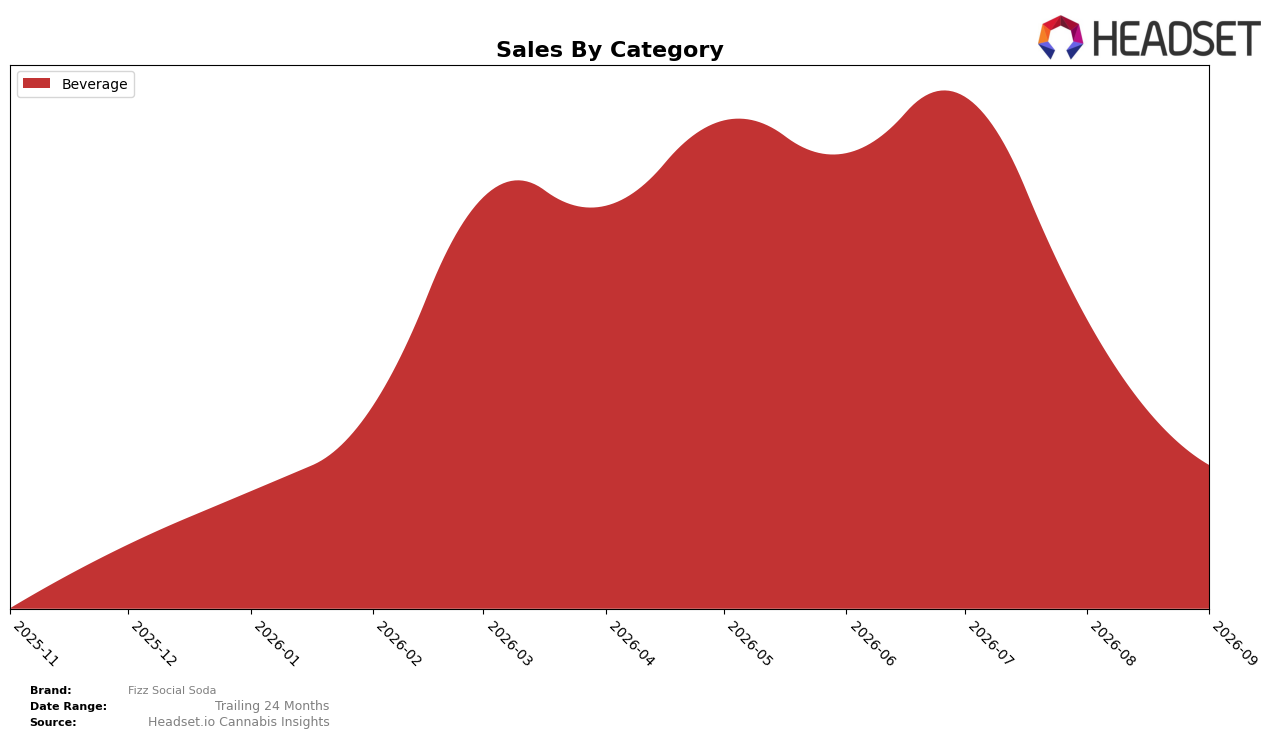
In September 2026, Fizz Social Soda operated as a single-category brand with Beverage at 100.0% of mix and a month-over-month decline of 38.2%, while year-over-year is unspecified and therefore not contributing directional context. With average price at $5.07 and no other categories contributing any share, the category concentration reached 100.0% and rank data for Beverage in Connecticut is unavailable, placing emphasis on internal mix shifts rather than market position. This pattern implies exposure to monthly volatility driven entirely by Beverage, where a 38.2% MoM decline without offset from adjacent categories suggests limited buffering capacity.
The all-in Beverage focus at 100.0% share combined with a 38.2% MoM contraction signals a positioning that prioritizes depth over breadth, trading diversification resilience for sharper swings. With rank in Beverage for Connecticut not reported and year-over-year undetermined, the immediate implication is that September 2026 performance hinges on short-cycle demand and promotional cadence rather than cross-category spillover or portfolio hedging. This suggests the brand’s current stance is optimized for Beverage-specific execution, where improvement depends more on intra-category levers than on mix reallocation.
Competitive Landscape
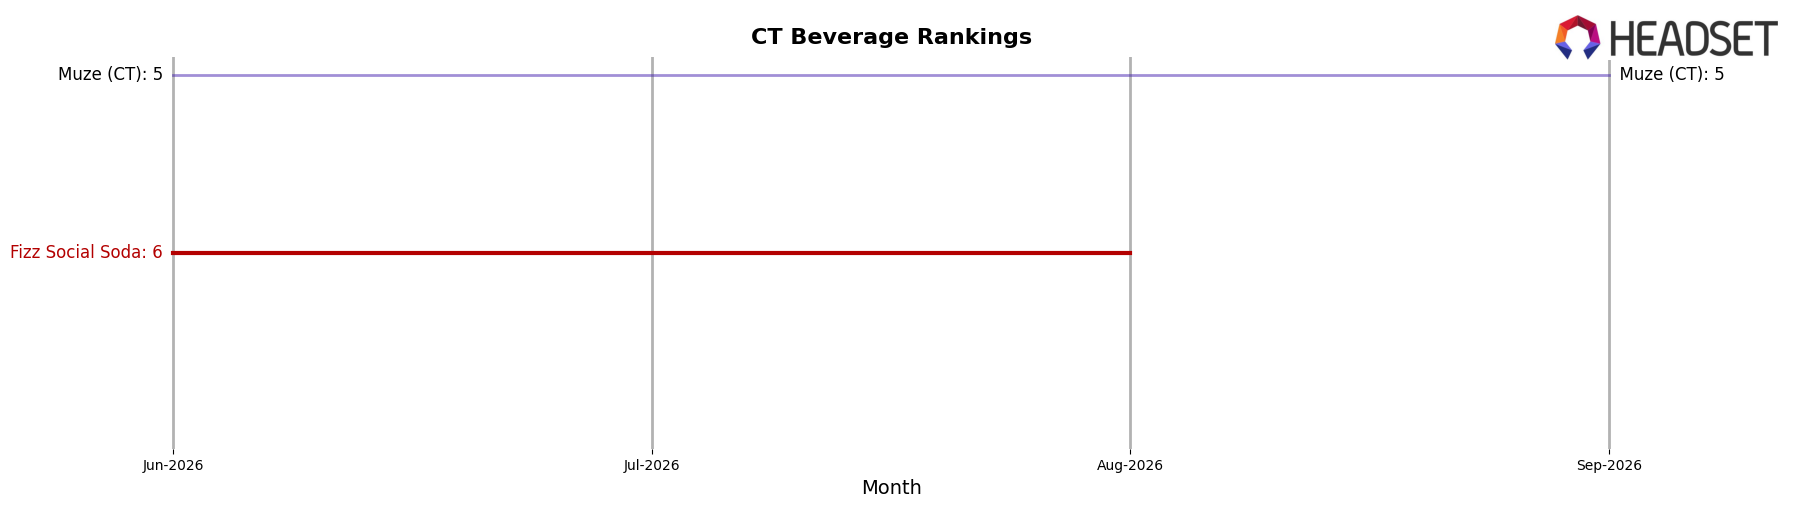
Fizz Social Soda sits at rank #6 in CT Beverage for September 2026, unchanged from #6 in June 2026, while its peak of #4 in March 2026 marks a two-position slide since early spring; this flat quarter paired with a two-rank retreat from March indicates momentum has cooled relative to earlier in the year. Competitors are moving: Zero Proof holds #2 with a +2 YoY rank gain and 83.8% YoY sales growth, and Soundview is #3 with a +4 YoY rank change and 230.8% YoY sales growth, while Muze (CT) fell to #5 with a +3 YoY rank change but a -24.5% YoY sales decline; in contrast, Fizz Social Soda’s steady #6 quarter and drop from #4 in March suggest it is being outpaced by faster risers and risks further share erosion if trajectory does not turn.
Notable Products
Hemp Derived Diet Cola (3mg THC, 12oz, 355ml) posted the steepest decline in September 2026 at -56.5% and sat at rank 2, while Orange Soda (3mg THC, 12oz, 355ml) fell even further at -63.7% to rank 3. Black Cherry Soda (3mg THC, 12oz, 355ml) held rank 1 despite a -14.7% month-over-month drop, indicating share consolidation at the top even as volumes retreat. All top-10 entries cited are Beverages, concentrating category exposure while the two largest declines occur below the category leader and one SKU pairs a rank of 2 with a -56.5% slide. This pattern implies a defensive product mix where the flagship anchors visibility but second-tier flavors are contracting, signaling a need to rebalance assortment depth around the leader while pruning underperforming extensions.
Top Selling Cannabis Brands






Data for this report comes from real-time sales reporting by participating cannabis retailers via their point-of-sale systems, which are linked up with Headset’s business intelligence software. Headset’s data is very reliable, as it comes digitally direct from our partner retailers. However, the potential does exist for misreporting in the instance of duplicates, incorrectly classified products, inaccurate entry of products into point-of-sale systems, or even simple human error at the point of purchase. Thus, there is a slight margin of error to consider. Brands listed on this page are ranked in the top twenty within the market and product category by total retail sales volume.

