.svg)

Sep-2026
Sales
Trend
6-Month
Product Count
SKUs
Avg Price
YoY Sales Change
YoY Price Change


Market Insights Snapshot
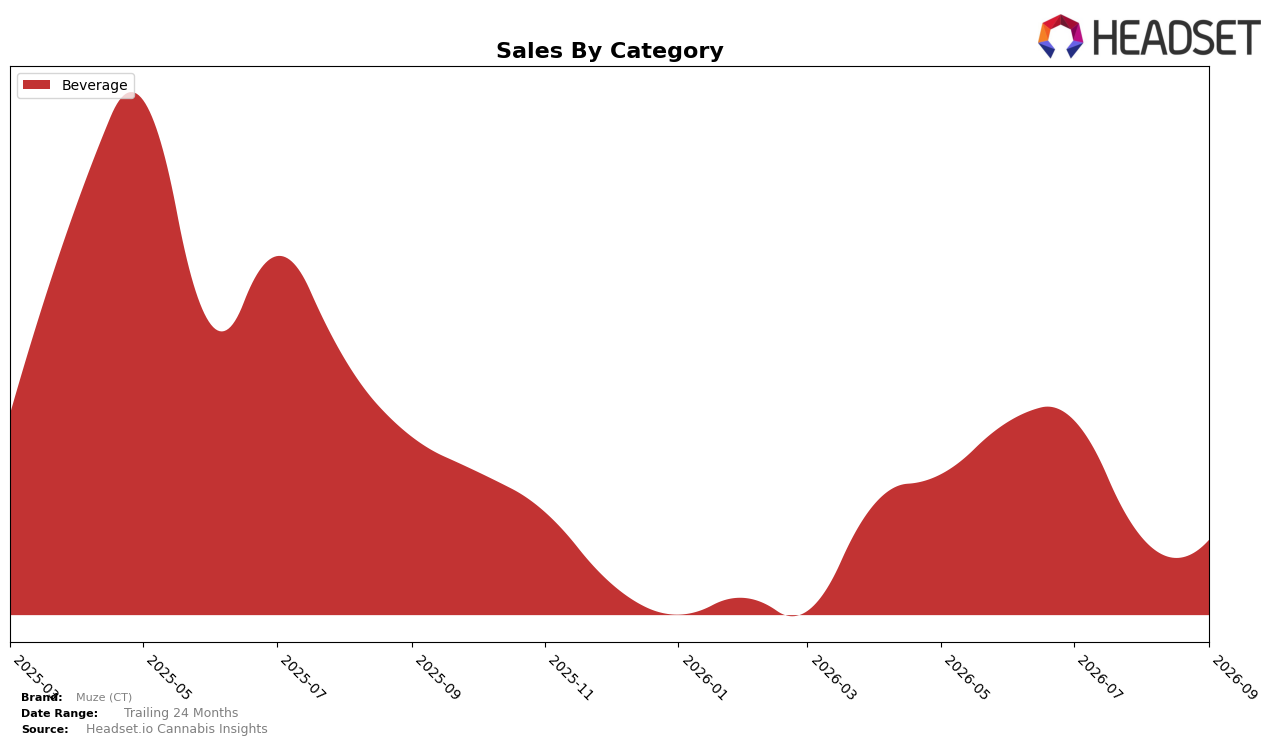
Muze (CT) operated as a single-category brand in Beverage, holding a 100.0% mix in September 2026 while posting a 5th place rank in Connecticut Beverage; within that footprint, year-over-year sales declined 24.46% alongside a month-over-month dip of 0.72%. Average price rose 14.41% year-over-year to $5.25 while the category share stayed concentrated at 100.0%, implying that performance pressure is internal to Beverage rather than a result of mix dilution; the thesis is that a price-up strategy amid a fully concentrated mix is not offsetting volume drag, constraining rank advancement at #5.
The combination of a 24.46% YoY sales decline and a 14.41% YoY price increase, paired with only a 0.72% MoM dip, implies price elasticity is biting most on annual comps while near-term trajectory is stabilizing at a lower base; with Beverage at 100.0% of sales and a #5 rank, the brand’s positioning skews toward maintaining margin over volume. The thesis is that September 2026 signals a need for either price recalibration or assortment depth within Beverage to regain volume without sacrificing the margin gains implied by the higher average price, because holding the #5 slot while shrinking YoY suggests limited headroom under the current pricing and category concentration.
Competitive Landscape
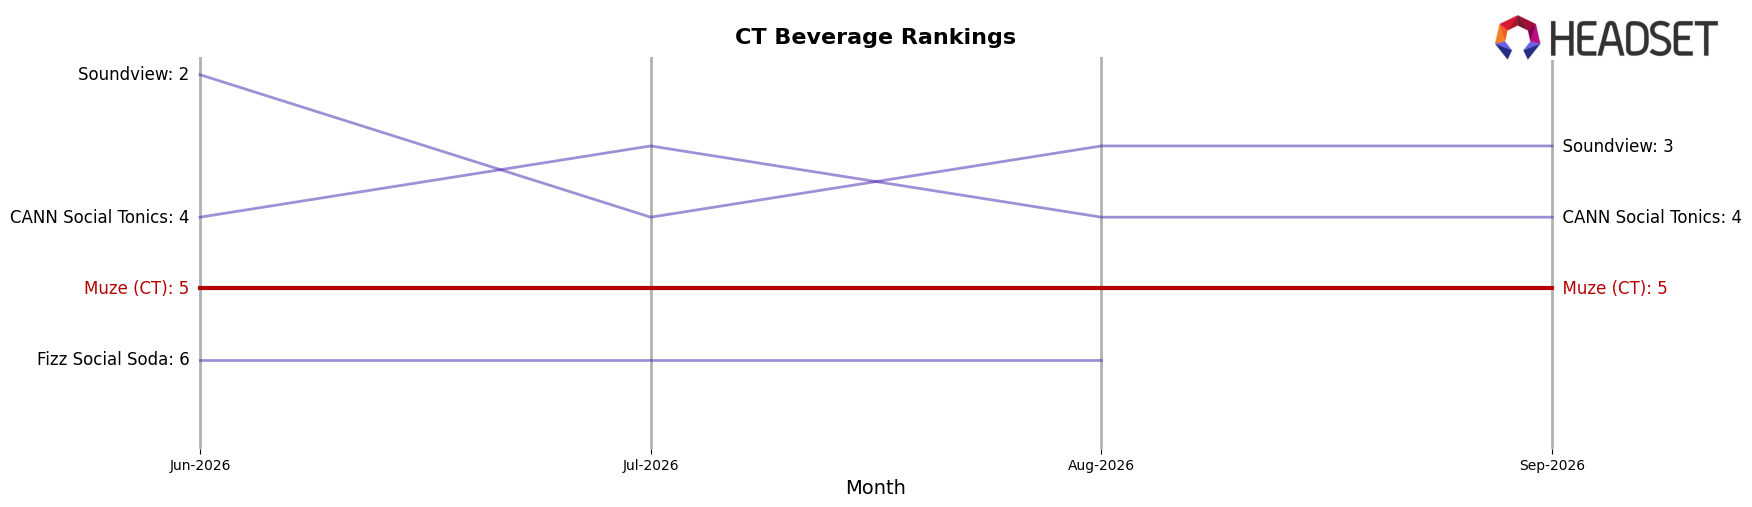
Muze (CT) sits at #5 in CT Beverage in September 2026, down 2 places year over year from #3, and flat versus June 2026 at #5, while its peak of #2 in May 2025 underscores a retreat in rank momentum; in contrast, Zero Proof rose to #2 with a 2-place YoY climb and 83.8% YoY sales growth, and Soundview advanced to #3 with a 4-place YoY surge and 230.8% YoY sales growth, whereas CANN Social Tonics edged to #4 with a 1-place YoY gain and 3.7% YoY sales growth; the directional spread—competitors compressing above while Muze (CT) holds at #5 quarter-on-quarter—implies that without a step-change in velocity or distribution, the brand’s rank trajectory risks further erosion as faster-rising peers consolidate the top four.
Notable Products
CBG/THC 5:1 Pure Seltzer (15mg CBG, 3mg THC, 12oz, 355ml) delivered a +408% month-over-month surge while sitting at rank 5, contrasted by CBG/THC 5:1 Peach Seltzer (15mg CBG, 3mg THC, 12oz, 355ml) dropping -23.8% at rank 4, indicating volatility at the tail of the lineup. CBG/THC 5:1 Raspberry Lime Seltzer (15mg CBG, 3mg THC, 12oz, 355ml) held rank 1 with +13.9% MoM, whereas CBG/THC 5:1 Black Cherry Seltzer (15mg CBG, 3mg THC, 12oz, 355ml) at rank 2 slipped -3.4%, signaling share consolidation toward the top SKU. With all top five products in Beverage and four of the top ten concentrated in flavored seltzers, the mix points to a single-format strategy where incremental growth is coming from flavor rotation rather than new categories, implying Muze (CT) is leaning into a depth play within seltzers over breadth expansion in September 2026.
Top Selling Cannabis Brands






Data for this report comes from real-time sales reporting by participating cannabis retailers via their point-of-sale systems, which are linked up with Headset’s business intelligence software. Headset’s data is very reliable, as it comes digitally direct from our partner retailers. However, the potential does exist for misreporting in the instance of duplicates, incorrectly classified products, inaccurate entry of products into point-of-sale systems, or even simple human error at the point of purchase. Thus, there is a slight margin of error to consider. Brands listed on this page are ranked in the top twenty within the market and product category by total retail sales volume.

