Jun-2026
Sales
Trend
6-Month
Product Count
SKUs
Avg Price
YoY Sales Change
YoY Price Change
Market Insights Snapshot
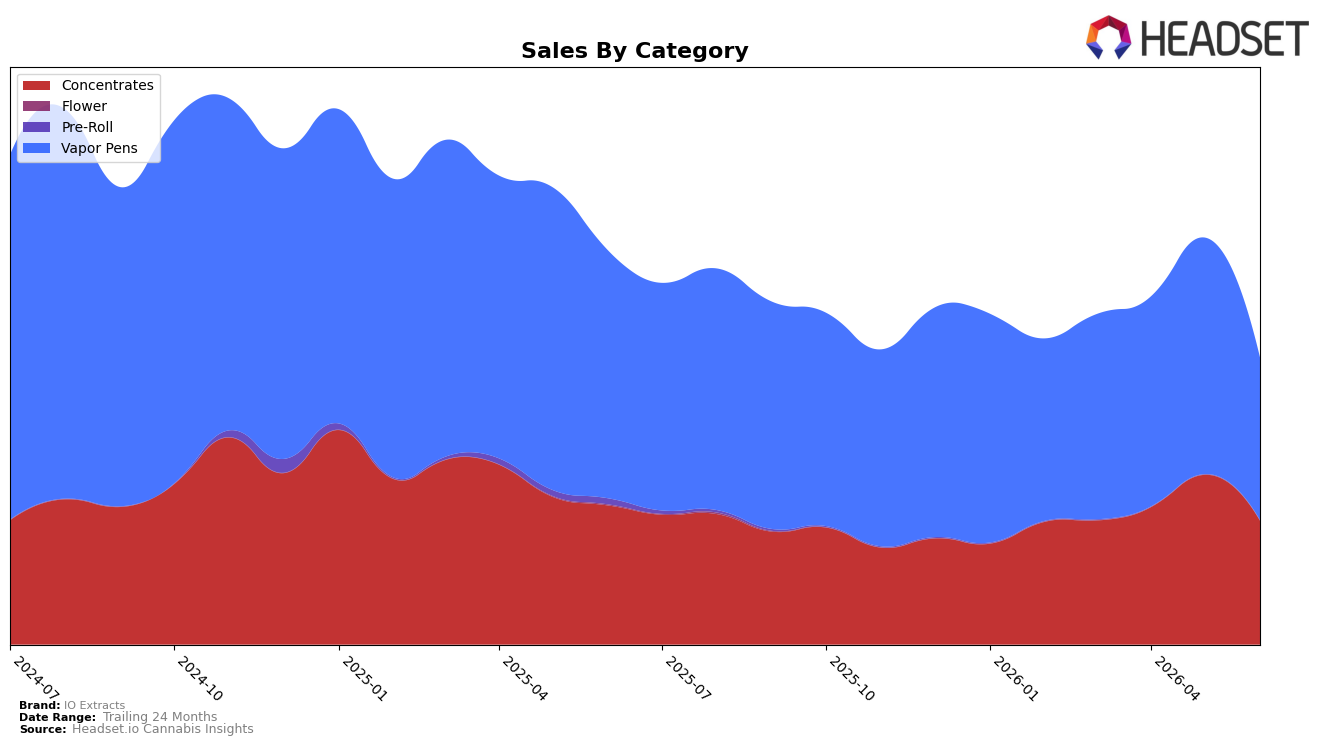
IO Extracts concentrated into two lines in June 2026, with Vapor Pens holding 56.77% share and Concentrates at 43.23%, while Vapor Pens fell 34.42% year over year and 31.31% month over month and Concentrates declined 10.99% year over year and 27.10% month over month; the brand’s average price dropped 12.34% year over year against a brand-level sales decline of 27.21%. In Arizona Vapor Pens, the brand sat at rank 20 even as Vapor Pens carried the larger share and deeper contractions, indicating a portfolio overweight to a faster-shrinking segment that is pulling overall performance below the Concentrates trajectory.
The mix shift implies margin and velocity pressure concentrated in Vapor Pens, where a 31.31% month-over-month slide against a 27.10% month-over-month decline in Concentrates suggests the rank 20 position is vulnerable if price cuts continue to outpace demand elasticity by 12.34% year-over-year price compression versus a 27.21% sales drop. With Concentrates showing a smaller year-over-year decline at 10.99% compared with Vapor Pens at 34.42%, the brand’s positioning would stabilize by reallocating emphasis toward the relatively steadier line while defending Vapor Pens distribution to prevent further share leakage from the current 56.77%/43.23% split.
Competitive Landscape
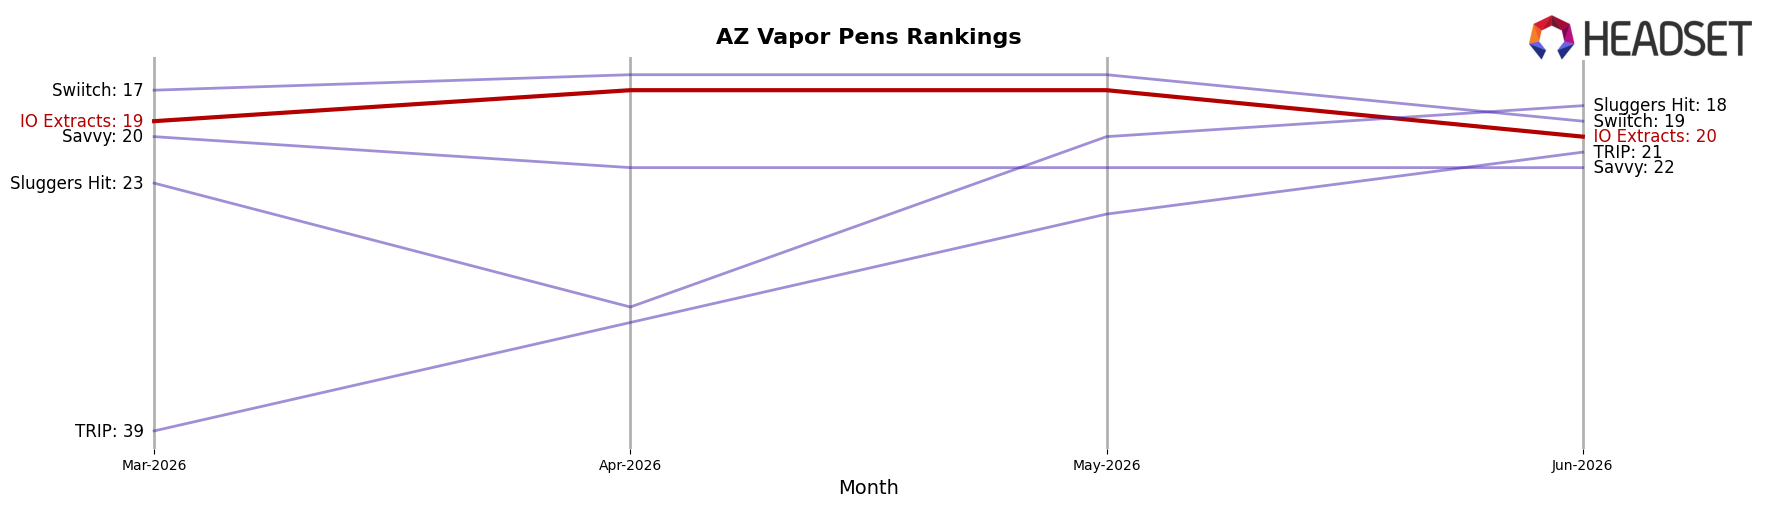
IO Extracts sits at rank #20 in AZ Vapor Pens in June 2026, down 6 spots year over year from #14 and off 1 position from March 2026’s #19, while still trailing its historical peak of #11 from February 2025; in contrast, Mfused held #1 year over year with a -19.4% YoY sales change and Abstrakt climbed from #5 to #2 on 162.2% YoY sales growth, outpacing IO Extracts’ downward rank shift and widening the competitive gap. The combination of a 6-rank YoY slide and a 1-rank decline over the past quarter, alongside competitors maintaining or improving top-five positions, implies IO Extracts is drifting from the consideration set that converts in the category and will likely cede share unless it reverses the rank trajectory.
Notable Products
Exotic Orange Apricot Distillate Disposable (1g) posted the steepest decline in June 2026 with a -15.8% MoM drop while holding rank 2, alongside double-digit pullbacks for Cantaloupe Crush Cured Resin Cartridge (1g) at -11.7% from rank 4 and Tropical Cookies Distillate Disposable (1g) at -11.9% from rank 5. Sour Diesel Distillate Cartridge (1g) stayed at rank 1 with a milder -5.1% MoM dip, and Sorbet Kush Distillate Disposable (1g) countered with +10.9% MoM at a tied rank 3, indicating volatility concentrated at the top ranks rather than broad weakness.
Vapor Pens occupy six of the top ten positions including ranks 1 through 6, yet three of those within ranks 2, 4, and 5 each fell more than -11%, while the single notable riser at rank 3 gained +10.9% and the leader at rank 1 slipped only -5.1%. Concentrates cluster at ranks 7–9 without reported MoM figures and around $6.1k per SKU, implying a stable secondary tier that is not yet moving the rank ladder.
Taken together, the pattern implies IO Extracts is leaning into a Vapor Pens-led lineup where rank resilience coexists with price- or promo-sensitive swings, suggesting commercial focus should prioritize stabilizing disposable SKUs while preserving the cartridge leader’s rank advantage.
Top Selling Cannabis Brands
Data for this report comes from real-time sales reporting by participating cannabis retailers via their point-of-sale systems, which are linked up with Headset’s business intelligence software. Headset’s data is very reliable, as it comes digitally direct from our partner retailers. However, the potential does exist for misreporting in the instance of duplicates, incorrectly classified products, inaccurate entry of products into point-of-sale systems, or even simple human error at the point of purchase. Thus, there is a slight margin of error to consider. Brands listed on this page are ranked in the top twenty within the market and product category by total retail sales volume.

