Jun-2026
Sales
Trend
6-Month
Product Count
SKUs
Avg Price
YoY Sales Change
YoY Price Change
Market Insights Snapshot
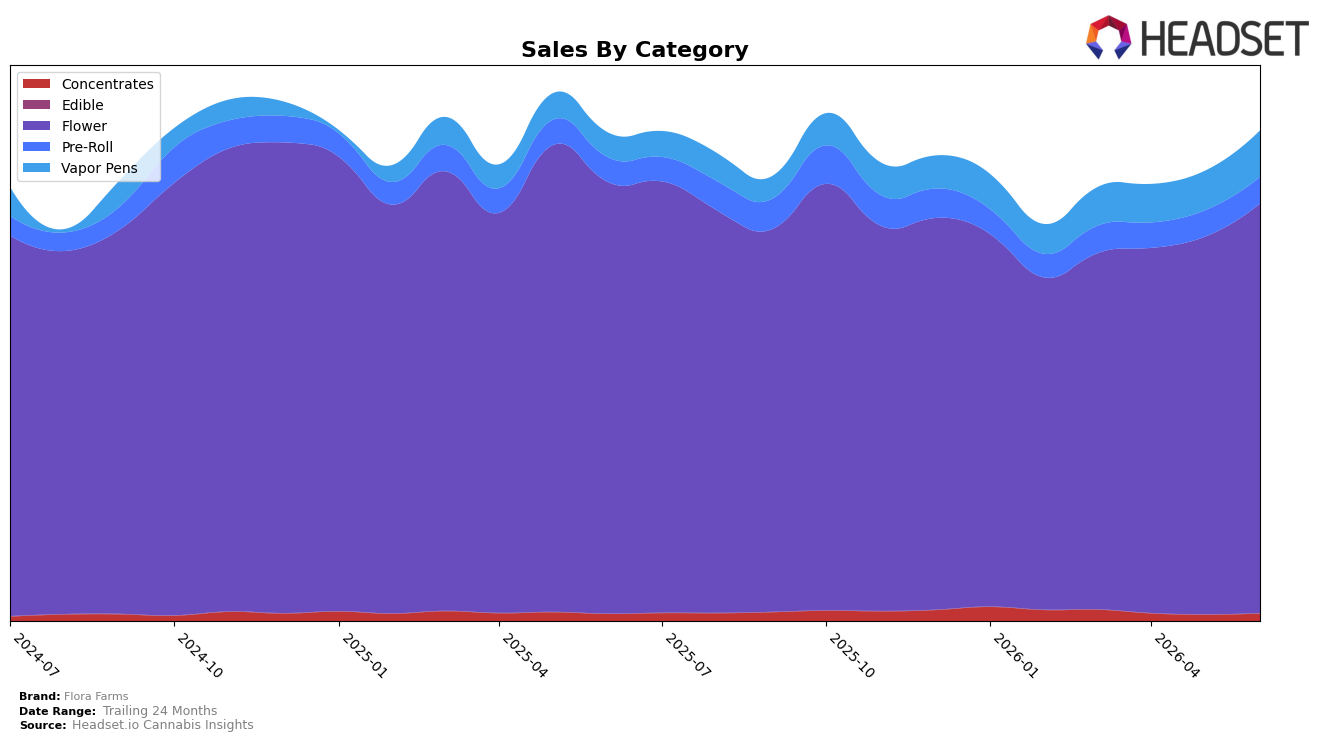
In June 2026, Flora Farms concentrated 83.75% of sales in Flower, where category sales fell 5.06% year over year but rose 8.52% month over month, while Vapor Pens expanded to 9.43% share on 88.93% YoY growth and a 17.83% MoM lift. Pre-Roll held 5.36% share with 7.69% YoY and 0.91% MoM growth, and Concentrates reached 1.46% share with 6.43% YoY and 18.79% MoM gains; alongside a 13.62% YoY drop in average price, these shifts indicate volume mix is tilting toward lower-ticket formats even as Flower remains the anchor. The thesis is that a Flower-led base paired with double-digit MoM gains in Vapor Pens and Concentrates signals near-term upside from basket breadth rather than deeper penetration in a single category.
The mix suggests Flora Farms is leveraging its top Flower rank position in Missouri to cross-sell into faster-growing adjuncts, as evidenced by Vapor Pens’ 17.83% MoM and Concentrates’ 18.79% MoM growth against Flower’s 8.52% MoM, while maintaining brand identity around Flower despite a 5.06% YoY decline there. With total brand sales up 44.49% YoY and average prices down 13.62% YoY, the pattern implies positioning as a value-forward destination where Flower scale drives traffic and emerging gains in Vapor Pens and Concentrates diversify the revenue stack without displacing the core.
Competitive Landscape
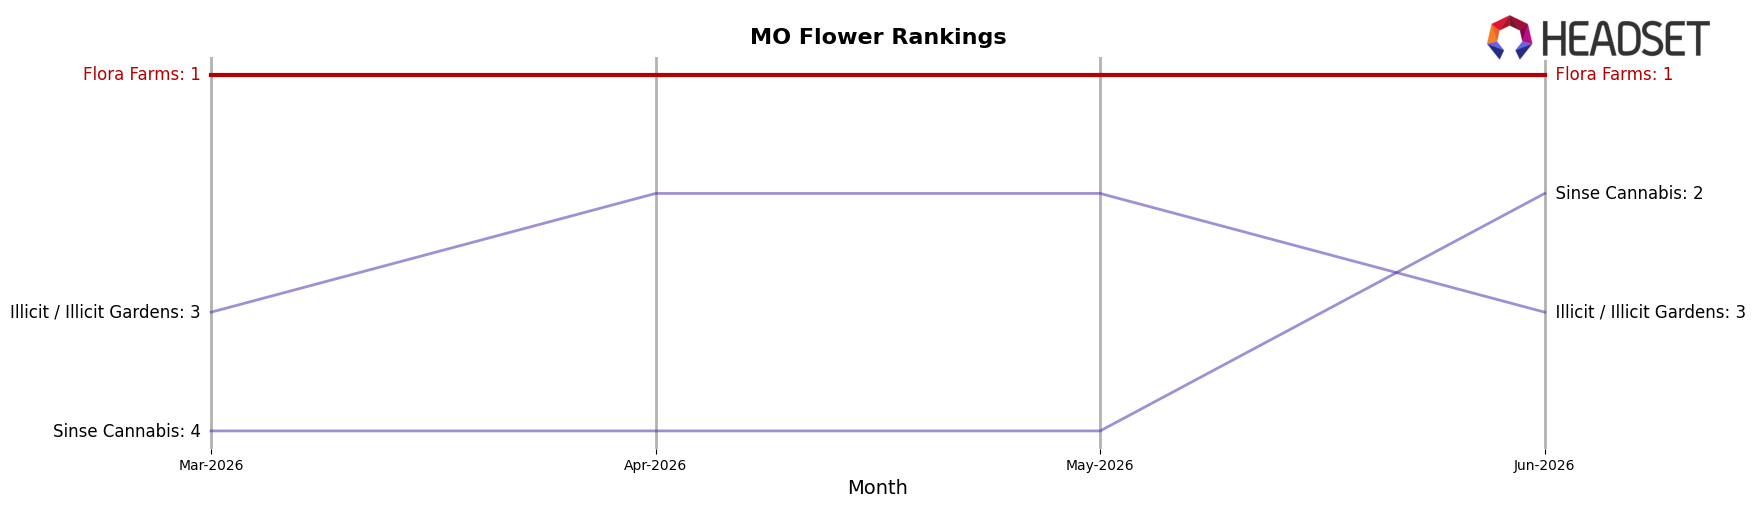
Flora Farms holds rank #1 in MO Flower in June 2026, unchanged from #1 a year earlier, while its three-month position also stayed at #1, indicating stability as rivals reshuffle; Sinse Cannabis advanced from #5 to #2 year over year with a 33.2% sales lift, and Amaze Cannabis climbed from #6 to #4 alongside a 43.8% sales increase, tightening the gap beneath the leader. Meanwhile, Illicit / Illicit Gardens held steady at #3 with a 5.8% sales gain, and Local Cannabis Co. jumped from #10 to #5 with 28.3% growth, underscoring that competitors are posting faster percentage gains even as Flora Farms remains at its peak rank #1 in June 2026; the pattern implies that maintaining the top position will require defending share against accelerating mid-pack climbers rather than just guarding against one incumbent rival.
Notable Products
Cheers - Key Lime Gelato Pre-Roll (1g) posted the standout move in June 2026 with a 129% month-over-month surge and a jump to rank 1, while Cheers - Palm Beach Sour Pre-Roll (1g) rose 12% to rank 2. Four of the top ten are Pre-Roll SKUs, occupying ranks 1, 2, 4, and 7–8, whereas Flower holds ranks 3, 5, 6, 9, and 10 with mixed momentum, including 24K Gold x Kosher Tangie (14g) up 6.6% at rank 5 and Bubba Fett (3.5g) down 0.3% at rank 6. The SKU concentration and rank shifts imply Flora Farms is tilting toward faster-turn Pre-Rolls at the top of the lineup while maintaining volume in larger Flower packs for base revenue stability.
Top Selling Cannabis Brands
Data for this report comes from real-time sales reporting by participating cannabis retailers via their point-of-sale systems, which are linked up with Headset’s business intelligence software. Headset’s data is very reliable, as it comes digitally direct from our partner retailers. However, the potential does exist for misreporting in the instance of duplicates, incorrectly classified products, inaccurate entry of products into point-of-sale systems, or even simple human error at the point of purchase. Thus, there is a slight margin of error to consider. Brands listed on this page are ranked in the top twenty within the market and product category by total retail sales volume.

