May-2026
Sales
Trend
6-Month
Product Count
SKUs
Avg Price
YoY Sales Change
YoY Price Change
Market Insights Snapshot
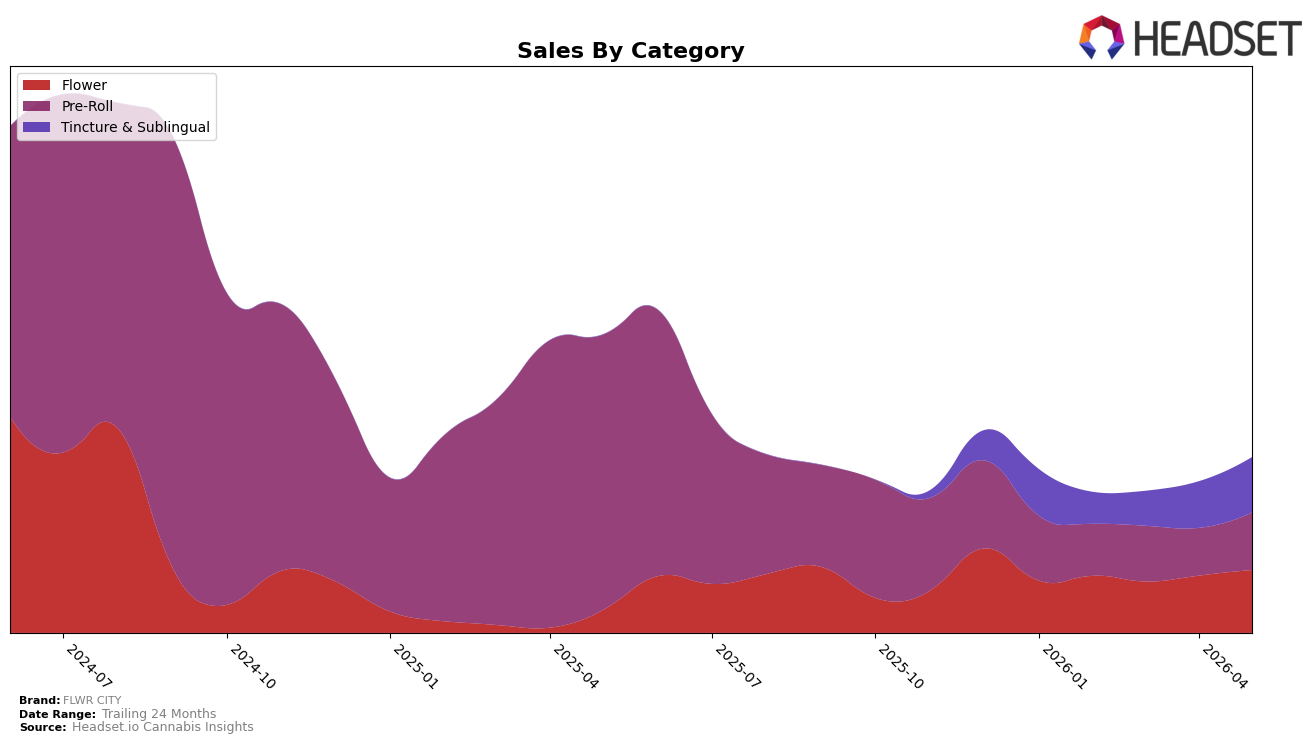
In May 2026, FLWR CITY’s mix tilted toward Flower at 35.76% share with 174.15% year-over-year growth and 9.90% month-over-month, while Pre-Roll held 32.78% share despite a -79.18% year-over-year drop and a 20.81% month-over-month rebound; Tincture & Sublingual accounted for 31.47% share with an 18.86% month-over-month increase and no year-over-year baseline. Despite total brand sales down 41.35% year over year and average price up 23.66%, the simultaneous month-over-month gains in all three categories suggest a near-term reacceleration concentrated in higher-velocity SKUs, with Flower absorbing demand lost from Pre-Roll’s year-over-year contraction.
With Tincture & Sublingual at 31.47% share and a category ranking of 10 in New York, the 18.86% month-over-month lift alongside Flower’s 9.90% month-over-month gain indicates a shift toward a two-pillar portfolio, while Pre-Roll’s -79.18% year-over-year decline signals reduced reliance on value-driven volume. The mix, coupled with a 23.66% average price increase and Flower pricing at $12.73 versus Tincture & Sublingual at $50.35, implies an intentional barbell strategy where premium-priced tinctures and lower-priced flower balance margin and traffic, positioning FLWR CITY to trade up select shoppers without abandoning entry-price segments.
Competitive Landscape
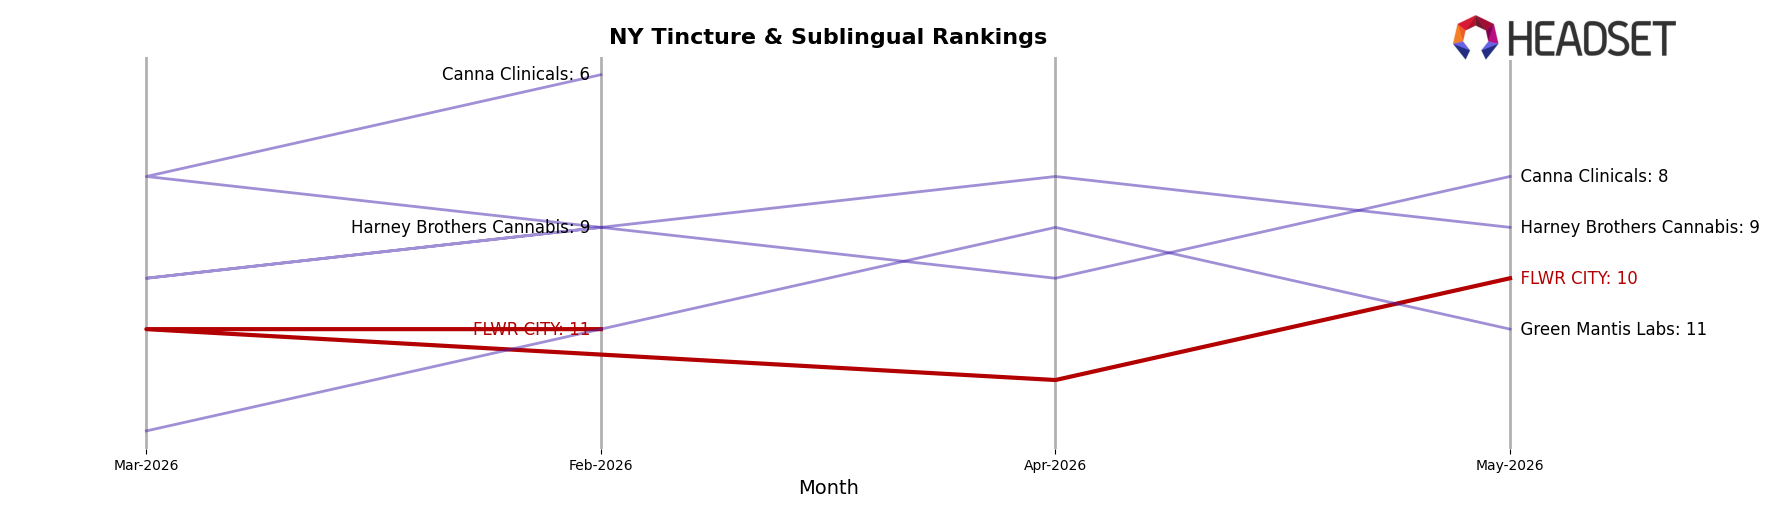
FLWR CITY sits at rank #10 in New York Tincture & Sublingual for May 2026, improving 1 position from #11 in February 2026 while remaining 1 spot below its January 2026 peak at #9; against this modest climb, Ayrloom held #1 with a 22.5% year-over-year sales gain and Head & Heal stayed #2 despite a 13.0% year-over-year decline, indicating the top tier is both stable in rank and mixed in momentum. Further, Veterans Choice Creations (VCC) rose from #4 to #3 with a 14.0% increase while Mfny (Marijuana Farms New York) slipped from #3 to #4 on a 34.6% drop, implying churn just above FLWR CITY’s lane and suggesting that holding near #10 while top rivals trade places points to a defensive position that relies on incremental share capture rather than breakout gains.
Notable Products
Black Panther (1g) posted the standout move in May 2026 with a 140.9% month-over-month surge to rank 1, while Dogwalkers - Top Gun Pre-Roll 10-Pack (3.5g) climbed 75.5% to rank 4. Dogwalkers - Cuban Affair Pre-Roll 3-Pack (1.05g) advanced 88.4% to rank 2, contrasting with Peanut Butter Breath Pre-Roll (1g) dropping 18.6% at rank 9. With four of the top ten coming from Flower and three from Pre-Roll, the mix tilts toward inhalables as volume leaders, implying FLWR CITY is leaning into fast-turn, terpene-forward formats to drive basket penetration.
Top Selling Cannabis Brands
Data for this report comes from real-time sales reporting by participating cannabis retailers via their point-of-sale systems, which are linked up with Headset’s business intelligence software. Headset’s data is very reliable, as it comes digitally direct from our partner retailers. However, the potential does exist for misreporting in the instance of duplicates, incorrectly classified products, inaccurate entry of products into point-of-sale systems, or even simple human error at the point of purchase. Thus, there is a slight margin of error to consider. Brands listed on this page are ranked in the top twenty within the market and product category by total retail sales volume.

