Market Insights Snapshot
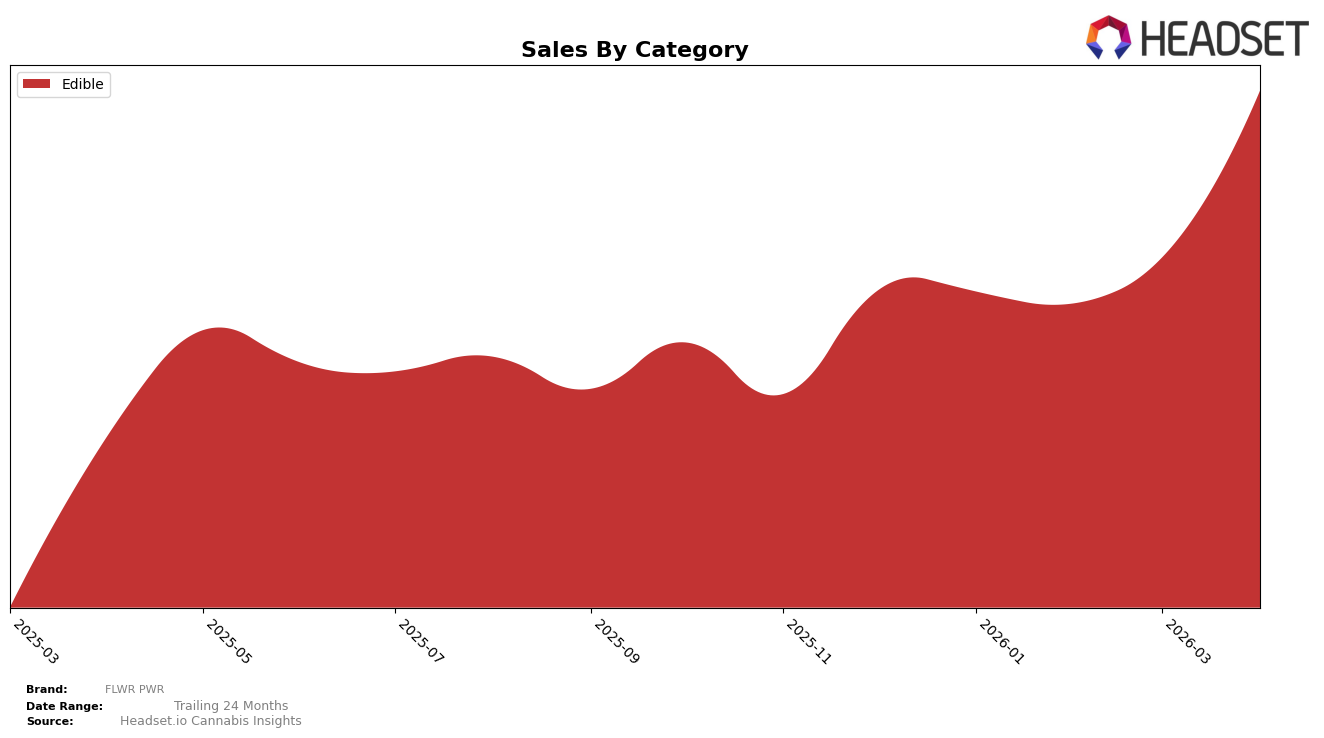
FLWR PWR has shown a notable improvement in the Edible category within Missouri. After consistently ranking at 36th place from January to March 2026, the brand broke into the top 30 in April, reaching the 28th position. This upward movement is significant as it highlights the brand's growing presence and appeal in the Missouri edible market. The increase in sales from March to April supports this trend, indicating a positive reception of their products among consumers in the state.
It is important to note that prior to April, FLWR PWR was not ranked within the top 30 brands in Missouri, suggesting a previous struggle to gain a foothold in this competitive market. However, the recent ranking improvement suggests a potential shift in market dynamics or successful strategic initiatives that have elevated the brand's status. Observers and stakeholders might want to keep an eye on whether FLWR PWR can maintain or improve this momentum in the coming months, as their April performance could be an indicator of future growth.
Competitive Landscape
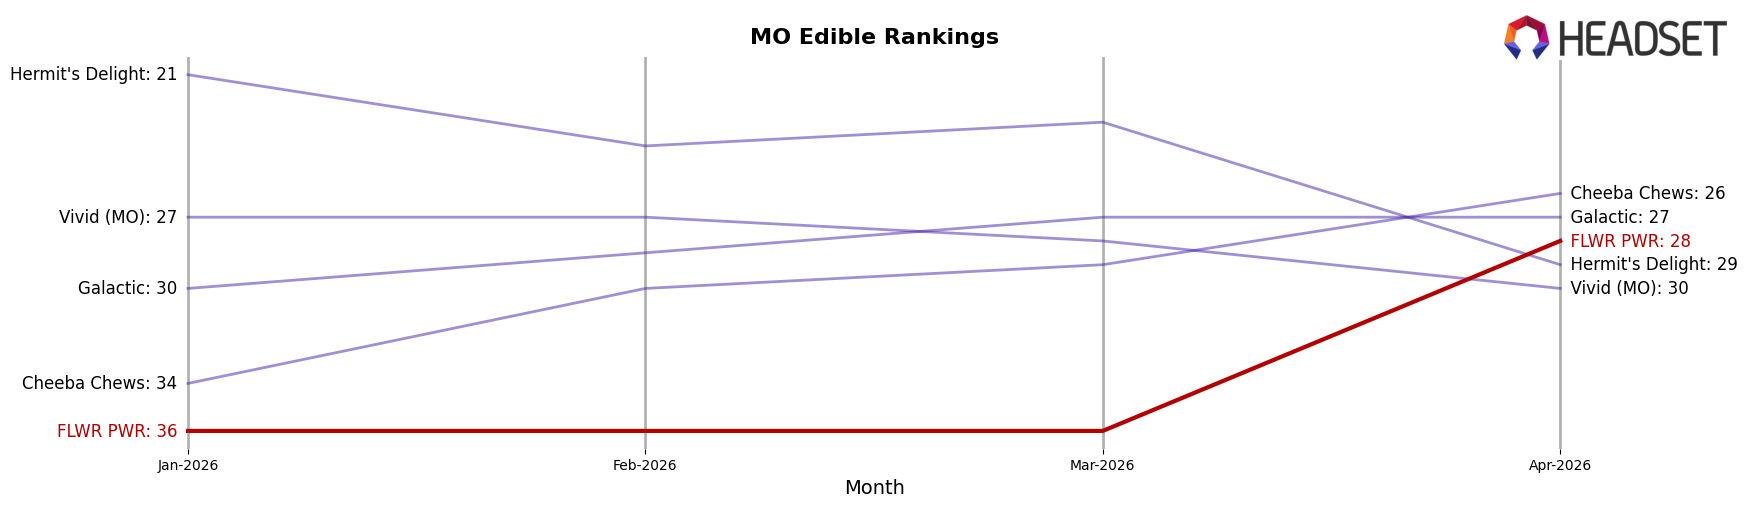
In the competitive landscape of the edible cannabis category in Missouri, FLWR PWR has shown a notable improvement in its market position from January to April 2026. Initially ranked 36th, FLWR PWR climbed to 28th place by April, indicating a positive trajectory in its sales performance. This upward movement contrasts with competitors like Vivid (MO), which experienced a decline from 27th to 30th place, and Hermit's Delight, which fell from 21st to 29th place over the same period. Meanwhile, Cheeba Chews showed a steady improvement, moving from 34th to 26th, and Galactic maintained a relatively stable position, despite missing data for February. These dynamics suggest that FLWR PWR's strategic efforts are yielding results, potentially capturing market share from competitors experiencing declines or stagnation.
Notable Products
In April 2026, the top-performing product from FLWR PWR was the CBN/THC 1:1 Blue Raspberry Blast Gummies 2-Pack, maintaining its first-place rank with sales of 1877 units. The CBD/THC 1:1 Sour Green Apple Gummies 2-Pack followed in second place, consistent with its ranking from the previous month, showing an impressive increase in sales. The CBG/THC 1:1 Cherry Bomb Gummy held steady in third place, continuing its stable performance across the months. The CBG/THC 1:1 Cherry Bomb Gummies 2-Pack remained in fourth place, demonstrating a slight increase in sales from March. Finally, the CBG/THC 1:1 Pineapple Paradise Gummies 10-Pack continued to rank fifth, despite a gradual sales decline over the months.
Top Selling Cannabis Brands
Data for this report comes from real-time sales reporting by participating cannabis retailers via their point-of-sale systems, which are linked up with Headset’s business intelligence software. Headset’s data is very reliable, as it comes digitally direct from our partner retailers. However, the potential does exist for misreporting in the instance of duplicates, incorrectly classified products, inaccurate entry of products into point-of-sale systems, or even simple human error at the point of purchase. Thus, there is a slight margin of error to consider. Brands listed on this page are ranked in the top twenty within the market and product category by total retail sales volume.

