.svg)
Aug-2026
Sales
Trend
6-Month
Product Count
SKUs
Avg Price
YoY Sales Change
YoY Price Change


Where to Buy
Fly is stocked at 129 licensed dispensaries across Michigan and Oklahoma, 128 of them in Michigan, with the deepest coverage in New Buffalo, Detroit, Monroe, Battle Creek, and Kalamazoo. Search by ZIP code or city below to find the closest one, or filter by product type if you are after a specific format.
Market Insights Snapshot
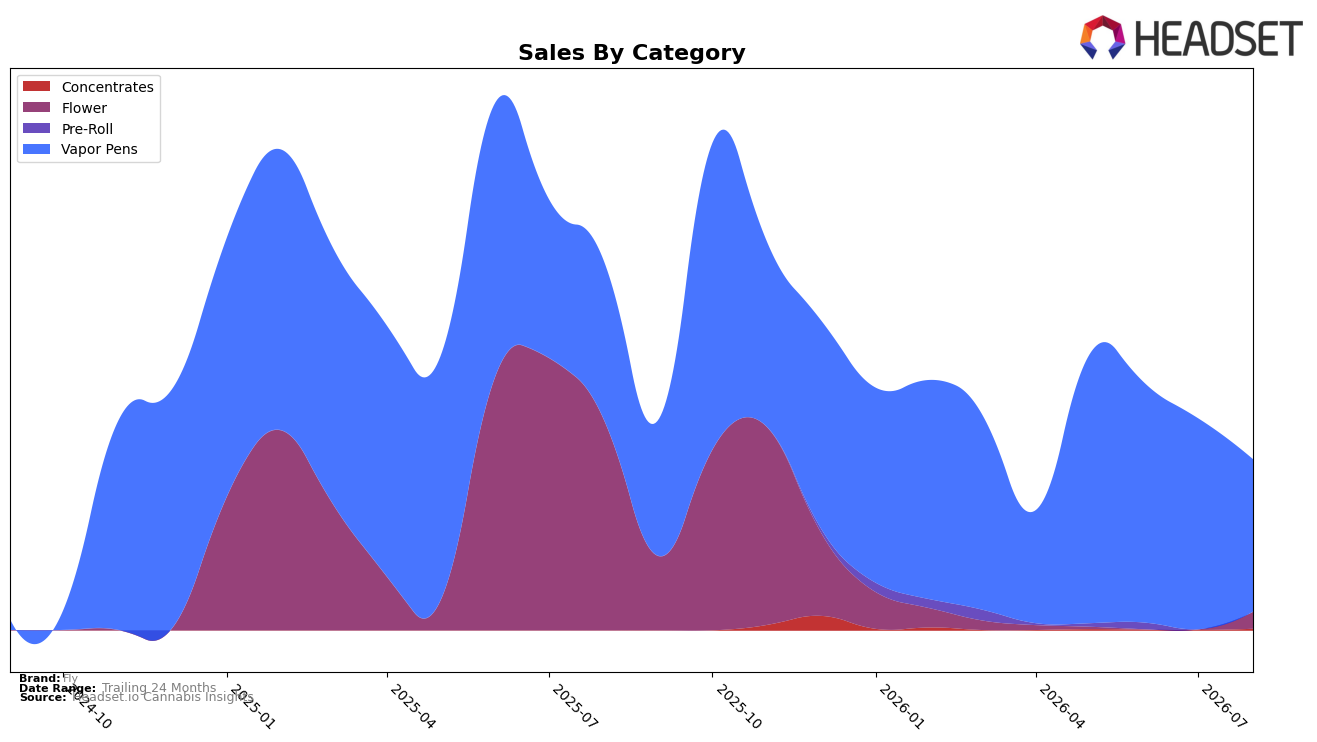
In August 2026, Fly’s mix concentrated in Vapor Pens at 89.26% share, even as that category fell 27.83% month over month and 3.91% year over year, while Flower jumped to 9.73% share on a 7,162.12% MoM surge despite a 92.11% YoY decline. Concentrates entered at 1.01% share with a 270.22% MoM increase and no year-over-year baseline, and the brand’s average price declined 11.40% YoY alongside a brand-level sales contraction of 53.75% YoY. With Vapor Pens rank at 34 in Michigan and a 24‑month sales expansion of 2,421.65%, the pattern implies Fly is tightening around a single anchor category while opportunistically backfilling with Flower and Concentrates to stabilize volatility.
The steep MoM pullback in Vapor Pens at 27.83% alongside the outsized MoM rebound in Flower at 7,162.12% and a 270.22% MoM lift in Concentrates suggests Fly is trading depth for breadth to defend relevance despite a 3.91% YoY decline in its core and a 92.11% YoY collapse in Flower. Coupled with an 11.40% YoY price contraction and a 53.75% YoY sales decline, holding 89.26% of mix in Vapor Pens while sitting at rank 34 in Michigan implies Fly’s positioning hinges on price-accessible pens with selective category re-entry to recapture shoppers and reduce dependence on a single category’s cyclicality.
Competitive Landscape
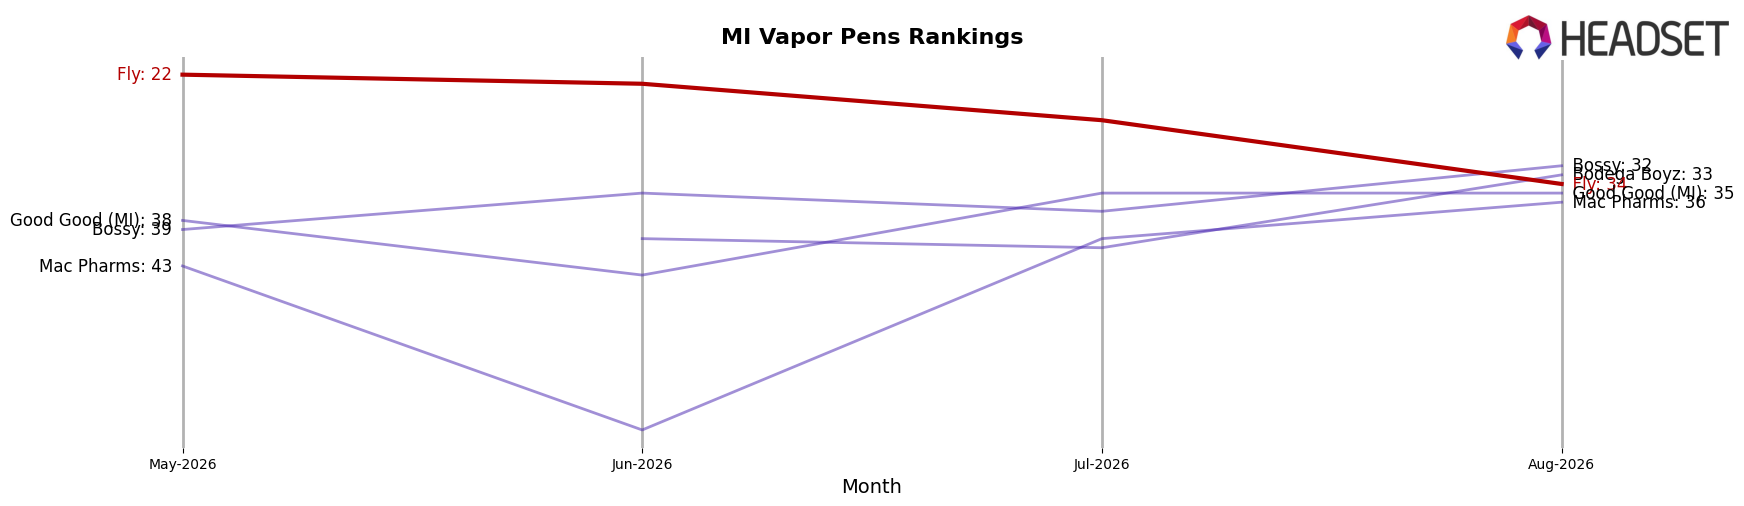
Fly is ranked #34 in Michigan Vapor Pens in August 2026, down 2 positions year over year from #32, and down 12 positions versus May 2026 when it was #22; this places Fly 17 positions below its peak #17 achieved in June 2025 and 33 positions behind the current leader. In contrast, MKX Oil Company moved from #2 to #1 with 24.7% year-over-year sales growth, while Muha Meds edged up from #3 to #2 despite a -8.9% sales change; additionally, Society C surged from #16 to #4 with a 321.3% increase, indicating Fly’s relative decline is less about market contraction and more about share capture by faster-rising rivals. The pattern implies Fly’s rank trajectory is one of erosion from a mid-pack position toward the lower third, suggesting near-term competitiveness hinges on countering competitor momentum rather than cyclical category shifts.
Notable Products
Animal Ice Mints Distillate Cartridge (1g) posted the steepest decline at -56.9% MoM while holding rank 10, and Lemon Cherry Gelato Distillate Cartridge (1g) fell -52.7% MoM at rank 9, indicating demand compression at the lower end of the top 10. At the top, Fruit Mania Distillate Cartridge (1g) slipped -9.2% MoM yet stayed at rank 1, whereas California Cherry Distillate Cartridge (1g) dropped -20.6% MoM at rank 2, pointing to a widening performance gap between the lead SKU and its nearest follower. Eight of the top ten are Vapor Pens SKUs with double-digit declines, and Bubblegum Distillate Cartridge (1g) at rank 7 fell -46.4% MoM despite still contributing $12,269, signaling broad category fatigue rather than isolated SKU weakness. The pattern implies Fly is overexposed to a softening Vapor Pens mix, and August 2026 performance suggests a need to rebalance toward fewer, higher-velocity cartridges or diversify beyond pens to stabilize share.
Top Selling Cannabis Brands






Data for this report comes from real-time sales reporting by participating cannabis retailers via their point-of-sale systems, which are linked up with Headset’s business intelligence software. Headset’s data is very reliable, as it comes digitally direct from our partner retailers. However, the potential does exist for misreporting in the instance of duplicates, incorrectly classified products, inaccurate entry of products into point-of-sale systems, or even simple human error at the point of purchase. Thus, there is a slight margin of error to consider. Brands listed on this page are ranked in the top twenty within the market and product category by total retail sales volume.

