May-2026
Sales
Trend
6-Month
Product Count
SKUs
Avg Price
YoY Sales Change
YoY Price Change
Market Insights Snapshot
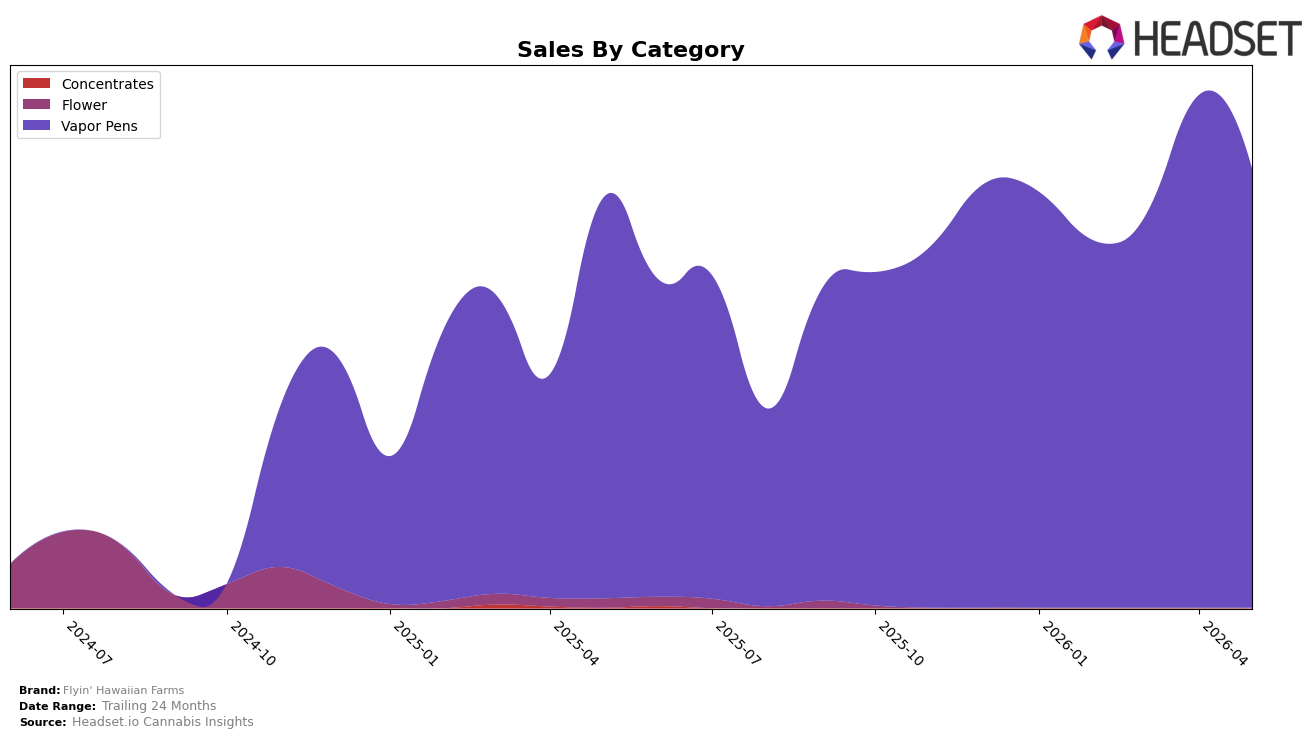
In May 2026, Flyin' Hawaiian Farms operated as a single-category brand with Vapor Pens accounting for 100.0% of sales, pairing a 9.60% year-over-year gain with a -14.32% month-over-month contraction; this sits alongside a brand-level 7.10% year-over-year sales increase and a -4.60% average price change. The average item price at $12.05 concentrated entirely in Vapor Pens indicates price-led volume support despite the negative month-over-month swing, and a 625.05% two-year sales expansion reframes the recent dip as a pacing reset rather than a structural retreat; the thesis is that a mono-category mix amplifies volatility month to month while preserving year-over-year momentum.
Positionally, concentrating 100.0% of sales in Vapor Pens leaves Flyin' Hawaiian Farms tightly exposed to subcategory cycles, with May 2026 rank 30 in Colorado suggesting mid-pack visibility that can shift quickly when month-over-month declines reach -14.32% alongside a -4.60% price move. Given a 9.60% category year-over-year lift coexisting with brand-year-over-year growth of 7.10%, the brand is slightly lagging its own category trajectory near-term while still converting on a 625.05% 24‑month sales rise; the thesis is that stabilization or selective mix expansion within Vapor Pens is required to protect rank 30 and convert price compression into durable share gains.
Competitive Landscape
Flyin' Hawaiian Farms sits at rank #30 in CO Vapor Pens in May 2026, improving 3 positions YoY from #33 and rising 4 spots from #34 in February 2026, while also marking a peak rank of #30 in May 2026; in contrast, Spherex held #1 both YoY and currently despite a -14.1% sales change, and PAX climbed from #3 YoY to #2 with +24.0% sales growth. Meanwhile, Bonanza Cannabis Company fell from #2 YoY to #4 alongside a -46.5% sales shift, whereas Spectra jumped from #14 YoY to #5 with +135.3% sales, indicating that Flyin' Hawaiian Farms’ gradual rank gains amid volatile leader movements suggest a foothold strategy that depends on steady share capture rather than outsized surges.

Notable Products
Mango Tango Distillate Cartridge (1g) posted the steepest decline in May 2026 at -25.3% MoM while dropping to rank 2, and Blue Kush Distillate Cartridge (1g) fell -32.8% MoM while sitting at rank 8. Orange Runtz Distillate Cartridge (1g) was the lone gainer at +8.0% MoM and held rank 1, whereas Cranberry Kush Distillate Cartridge (1g) slid -29.6% MoM at rank 6. With all ten top products in Vapor Pens and seven registering double-digit MoM declines, the mix points to a concentration that magnifies volatility and signals the need to rebalance flavor breadth or pricing within cartridges.
Top Selling Cannabis Brands
Data for this report comes from real-time sales reporting by participating cannabis retailers via their point-of-sale systems, which are linked up with Headset’s business intelligence software. Headset’s data is very reliable, as it comes digitally direct from our partner retailers. However, the potential does exist for misreporting in the instance of duplicates, incorrectly classified products, inaccurate entry of products into point-of-sale systems, or even simple human error at the point of purchase. Thus, there is a slight margin of error to consider. Brands listed on this page are ranked in the top twenty within the market and product category by total retail sales volume.

