.svg)

Aug-2026
Sales
Trend
6-Month
Product Count
SKUs
Avg Price
YoY Sales Change
YoY Price Change


Where to Buy
Garden Society is stocked at 95 licensed dispensaries across Massachusetts, New Jersey, and California, 42 of them in Massachusetts, with the deepest coverage in Cambridge, Springfield, Boston, Northampton, and Ayer. Search by ZIP code or city below to find the closest one, or filter by product type if you are after a specific format.
Market Insights Snapshot
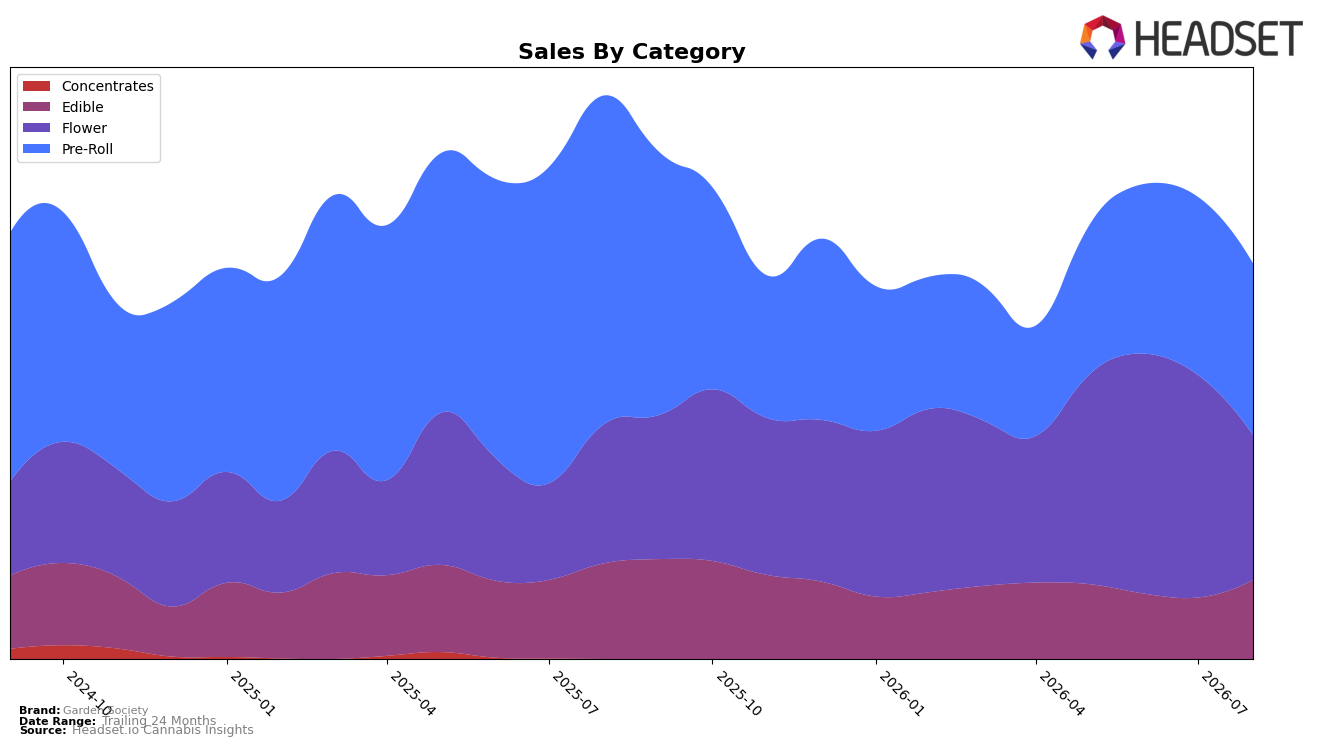
In August 2026, Garden Society’s mix skewed toward Pre-Roll at 43.41% share despite a year-over-year decline of 47.82% and a month-over-month dip of 3.60%, while Flower held 36.61% share with a 4.08% year-over-year increase but a 34.98% month-over-month drop. Edible rose to 19.98% share with a 28.79% month-over-month gain despite a 17.26% year-over-year decline, and average price across the brand rose 23.46% year-over-year even as total brand sales fell 29.84% year-over-year. With Flower ranked 56 in Massachusetts, the pattern implies Garden Society is leaning on higher-priced segments while Pre-Roll contraction and Flower volatility are reshaping volume toward Edible recovery.
The shift toward pricier formats — Pre-Roll at a $47.84 average price and Flower at $56.14 — alongside a 23.46% brand-wide price lift and a 29.84% year-over-year sales decline suggests elasticity pressures that push value-seeking customers into Edible, where month-over-month growth of 28.79% contrasts with a 34.98% month-over-month retreat in Flower. With Pre-Roll still the largest share at 43.41% but posting a 47.82% year-over-year drop, and Flower’s small year-over-year gain offset by steep monthly pullback, the mix implies a repositioning window: sustaining Edible’s 19.98% share momentum can buffer volatility in inhalables while targeted pricing and pack architecture in Flower and Pre-Roll could stabilize rank 56 in Massachusetts.
Competitive Landscape
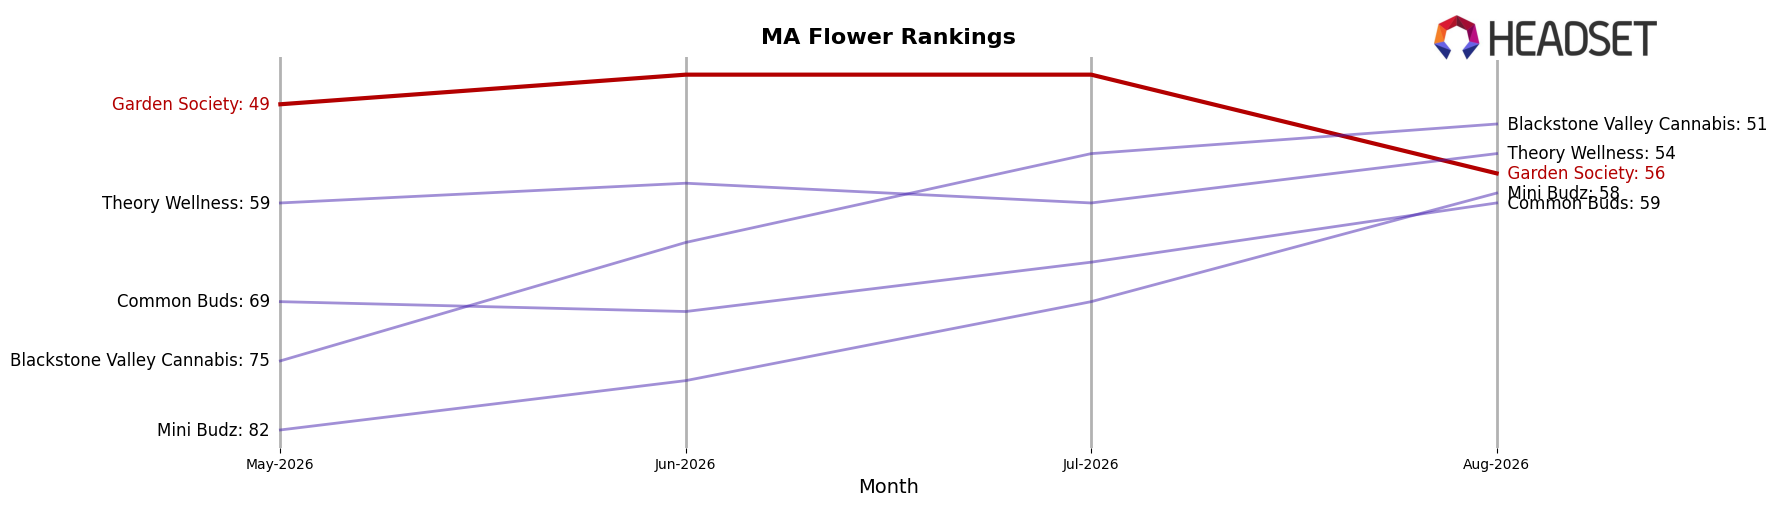
Garden Society is ranked 56 in Massachusetts Flower in August 2026, improving 48 positions year over year from rank 104, but slipping 7 places from rank 49 in May 2026 to 56 in August 2026 while also coming off a peak of rank 46 in July 2026; meanwhile, Perpetual Harvest advanced from rank 4 to rank 1 year over year with 51.8% sales growth, and Simply Herb edged down from rank 1 to rank 3 with a 6.2% sales decline, indicating Garden Society’s mid‑year pullback after a July peak is happening as leaders consolidate at the top and that the brand’s YoY climb is real but not yet translating into sustained top‑50 presence.
Notable Products
Blissful Rest - CBD/THC 1:5 Tart Cherry Pinot Noir Gummies 20-Pack (20mg CBD, 100mg THC) posted the largest move in August 2026 with a 78.2% month-over-month increase and climbed into rank 3, while Wedding Cake x Kush Mints (14g) fell 16.9% MoM and slipped to rank 8. The category mix concentrated around Edibles, with five of the top ten slots held by gummies, indicating demand is tilting toward multi-cannabinoid formats. Blissful Rest - THC/CBN/CBD 1:1:1 Dreamberry Gummies 20-Pack (100mg THC, 100mg CBN, 100mg CBD) grew 11.7% MoM to hold rank 1 and Brighter Day - THC/CBG 1:1 Pineapple Gummies 20-Pack (100mg THC, 100mg CBG) rose 8.2% MoM at rank 2, suggesting the lead is reinforced by incremental gains at the top alongside a pronounced rebound in balanced-ratio SKUs. The product mix points to a pivot toward functional, ratioed gummies as the commercial core, with Flower volatility creating downside risk while Pre-Rolls provide secondary support.
Top Selling Cannabis Brands






Data for this report comes from real-time sales reporting by participating cannabis retailers via their point-of-sale systems, which are linked up with Headset’s business intelligence software. Headset’s data is very reliable, as it comes digitally direct from our partner retailers. However, the potential does exist for misreporting in the instance of duplicates, incorrectly classified products, inaccurate entry of products into point-of-sale systems, or even simple human error at the point of purchase. Thus, there is a slight margin of error to consider. Brands listed on this page are ranked in the top twenty within the market and product category by total retail sales volume.

