.svg)
Aug-2026
Sales
Trend
6-Month
Product Count
SKUs
Avg Price
YoY Sales Change
YoY Price Change


Market Insights Snapshot
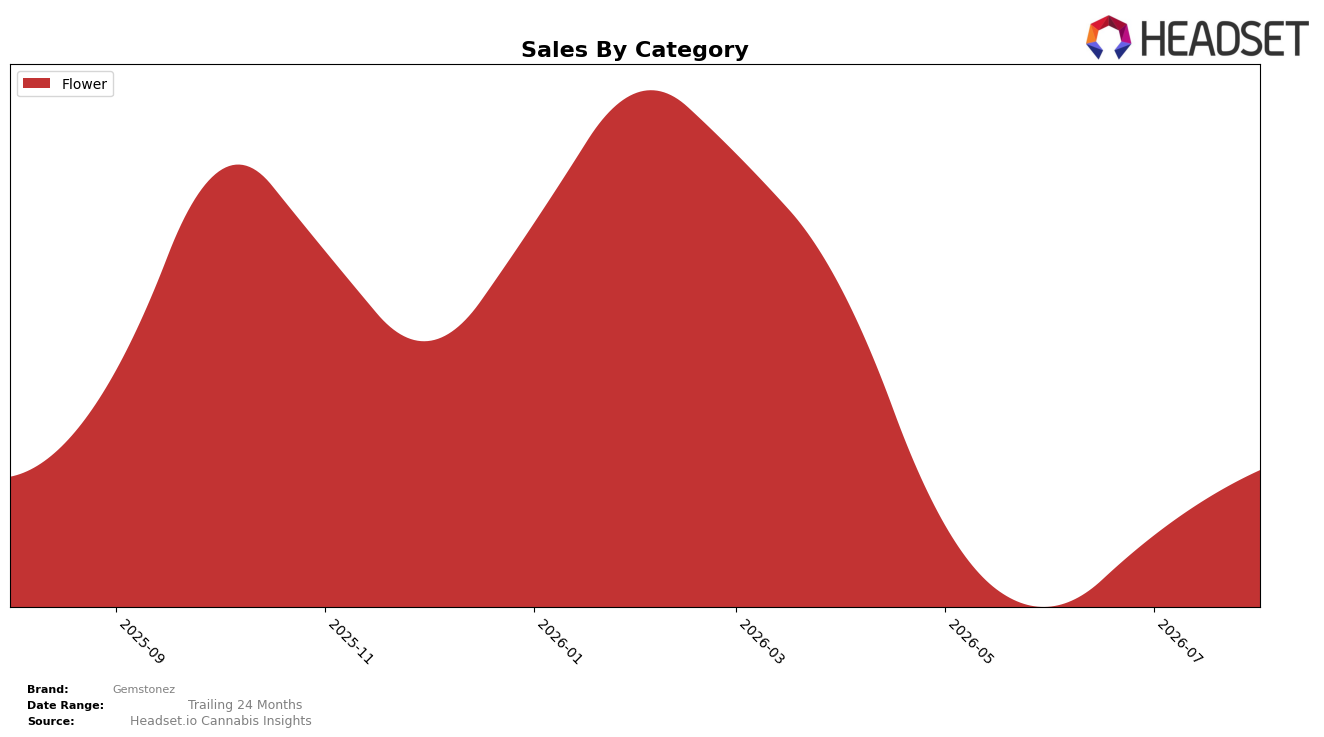
Gemstonez concentrated entirely in Flower at 100.0% share, with August 2026 sales up 3.0% year over year and 40.8% month over month, while the average price fell 67.1% YoY and sat at $21.79. Within Flower, the Saskatchewan rank was 40, and the mix shift versus prior months was effectively a deepening of a single-category bet rather than diversification, pairing a 3.0% YoY sales lift with a 40.8% MoM surge that arrived alongside steep price compression. The pattern implies volume-led gains inside Flower are offsetting price declines, locking Gemstonez into a price-sensitive posture within a single-category footprint.
With Flower at 100.0% of sales and a rank of 40 in Saskatchewan, the 40.8% MoM acceleration versus a modest 3.0% YoY suggests recent momentum is tactical rather than structural, driven by near-term pricing rather than mix expansion. The 67.1% YoY drop in average price alongside a 3.0% YoY sales rise indicates reliance on unit growth to sustain revenue, while the sole-category focus constrains cross-category buffer if Flower demand normalizes. This positioning implies Gemstonez is competing chiefly on accessible price within Flower, where maintaining or improving rank 40 will depend on sustaining volume efficiency under continued price pressure.
Competitive Landscape
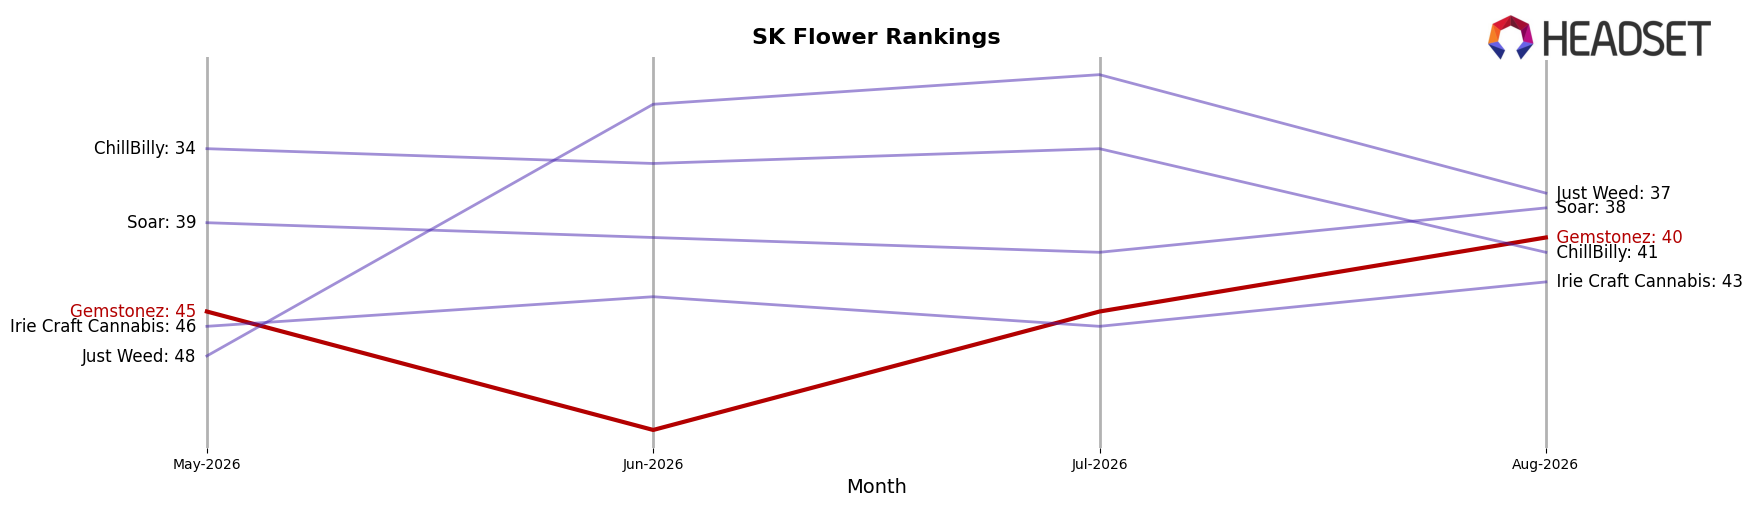
Gemstonez sits at rank #40 in August 2026, down 1 position year over year from #39 and up 5 spots versus three months ago from #45, a trajectory that trails peers who accelerated faster in both rank and growth rates. Back Forty / Back 40 Cannabis climbed from #3 to #1 while expanding sales by 124.7%, and Weed Me jumped from #28 to #5 with 317.1% YoY sales growth; by contrast, Gemstonez has not converted its February 2026 peak at #21 into sustained placement, slipping 19 ranks from that peak to today. With Big Bag O' Buds advancing from #8 to #2 alongside 171.2% YoY growth and Spinach edging from #2 to #3 while growing 57.6%, the pattern implies Gemstonez is being outpaced by faster-rising incumbents and needs a catalyst to reverse a mild YoY rank decline despite a recent 5-rank quarter-over-quarter recovery.
Notable Products
Bubblegum Diesel (3.5g) posted the standout movement in August 2026 with a +382% month-over-month surge to rank 1, while Frosted Bubba (3.5g) climbed to rank 2 on +146% MoM and Electric Melon (3.5g) jumped to rank 5 on +340% MoM. Electric Melon (7g) advanced to rank 4 with +83% MoM, and three of the top five are 3.5g SKUs, indicating velocity is concentrating in smaller pack sizes rather than bulk formats. The single raw dollar highlight is Bubblegum Diesel (3.5g) at $10,193, outpacing Electric Melon (7g) at rank 4 despite the latter’s larger size tier. The pattern implies Gemstonez is winning on rapid-turn Flower formats, suggesting a strategy centered on flavor-led 3.5g launches that convert quickly into top-5 placements.
Top Selling Cannabis Brands






Data for this report comes from real-time sales reporting by participating cannabis retailers via their point-of-sale systems, which are linked up with Headset’s business intelligence software. Headset’s data is very reliable, as it comes digitally direct from our partner retailers. However, the potential does exist for misreporting in the instance of duplicates, incorrectly classified products, inaccurate entry of products into point-of-sale systems, or even simple human error at the point of purchase. Thus, there is a slight margin of error to consider. Brands listed on this page are ranked in the top twenty within the market and product category by total retail sales volume.

