Jun-2026
Sales
Trend
6-Month
Product Count
SKUs
Avg Price
YoY Sales Change
YoY Price Change
Market Insights Snapshot
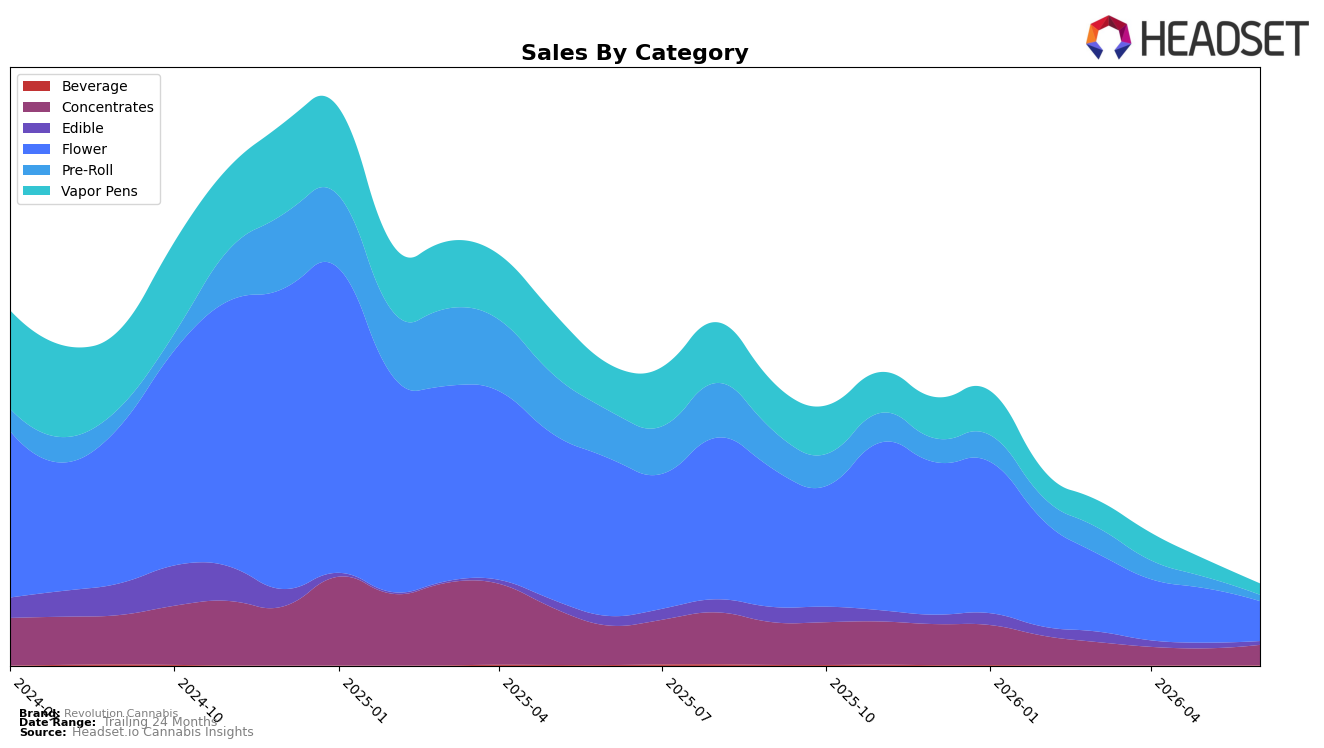
In June 2026, Revolution Cannabis concentrated half of its revenue in Flower at 49.07% share while the category declined 74.88% year over year and 26.95% month over month, indicating outsized drag from its largest line; Vapor Pens at 13.75% share fell 76.09% YoY and 36.95% MoM, compounding that contraction. By contrast, Concentrates carried 25.09% share with a 48.41% YoY decline yet a 20.68% MoM increase, and Beverage, though just 0.19% share, also rose 21.36% MoM against a 70.17% YoY drop. Pre-Roll at 7.53% share fell 87.20% YoY and 45.09% MoM, and Edible at 4.37% share slid 62.03% YoY and 34.58% MoM, reinforcing a broad-based retreat even as average price across the brand decreased 6.04% YoY. The pattern implies a shift away from inhalables dominated by Flower and Vapor Pens toward a relatively more stable Concentrates mix, with small but growing Beverage activity offering a test bed for diversification.
The mix shifts suggest Revolution Cannabis can reduce exposure to categories where declining velocity overwhelms price flexibility, as seen in Flower’s 74.88% YoY and 26.95% MoM drops alongside a brand-level 6.04% YoY average price decrease; reallocating toward Concentrates, which outperformed on a 20.68% MoM basis despite a 48.41% YoY decline, could lift near-term efficiency. With the brand ranked 46th in Flower in Illinois and facing a 36.95% MoM decline in Vapor Pens versus a 21.36% MoM gain in Beverage, the implied positioning favors depth in Concentrates and selective expansion in Beverage while de-emphasizing Pre-Roll, which dropped 45.09% MoM and 87.20% YoY. The thesis is that category reweighting toward Concentrates and exploratory Beverage can stabilize share while Flower and Vapor Pens are managed for margin rather than volume.
Competitive Landscape
Revolution Cannabis sits at rank #46 in IL Flower in June 2026, down 29 positions year over year from #17, and 16 positions lower than March 2026 when it held #30; against this backdrop, category leaders moved in the opposite direction as High Supply / Supply held #1 year over year with a 32.1% sales increase while &Shine advanced from #10 to #5 with a 28.5% gain. The current #46 also contrasts with Revolution Cannabis’s prior peak of #10 in January 2025 and represents a 14-rank slide just in the last three months, while nearby competitors show mixed momentum as RYTHM stayed at #2 despite a 5.2% sales decline and Simply Herb slipped from #3 to #4 with a 16.8% drop. The pattern implies that Revolution Cannabis’s trajectory has shifted from a prior top-10 ceiling toward lower-tier placement, and without a reversal that outpaces competitors’ double-digit gains the brand is likely to cede further share.

Notable Products
Black Cherry Lime Live Resin Gummies 10-Pack (100mg) plunged 44.7% month over month to rank 5 in June 2026, while Gorilla'd Cheese (3.5g) also slid 38.0% yet still held rank 1, indicating volume concentration at the top despite sharper declines in Edibles. Mac and Cheese (3.5g) in Flower inched up 2.1% and ranked 3, and with three Flower SKUs in the top ten including a 14g format at rank 10, the lineup tilts toward inhalables over ingestibles as Edibles at ranks 2, 4, and 5 all contracted between 24% and 45%. With Concentrates debuting at ranks 6 and 7 and a Vapor Pen at rank 8 without prior-month comps, the mid-pack is being rebuilt around higher-potency formats rather than gummy volume. The pattern implies a pivot toward inhalable potency and premium extracts, trading near-term Edible declines for a basket that supports higher-ticket mix and margin headroom.
Top Selling Cannabis Brands
Data for this report comes from real-time sales reporting by participating cannabis retailers via their point-of-sale systems, which are linked up with Headset’s business intelligence software. Headset’s data is very reliable, as it comes digitally direct from our partner retailers. However, the potential does exist for misreporting in the instance of duplicates, incorrectly classified products, inaccurate entry of products into point-of-sale systems, or even simple human error at the point of purchase. Thus, there is a slight margin of error to consider. Brands listed on this page are ranked in the top twenty within the market and product category by total retail sales volume.

