Apr-2026
Sales
Trend
6-Month
Product Count
SKUs
Avg Price
YoY Sales Change
YoY Price Change
Market Insights Snapshot
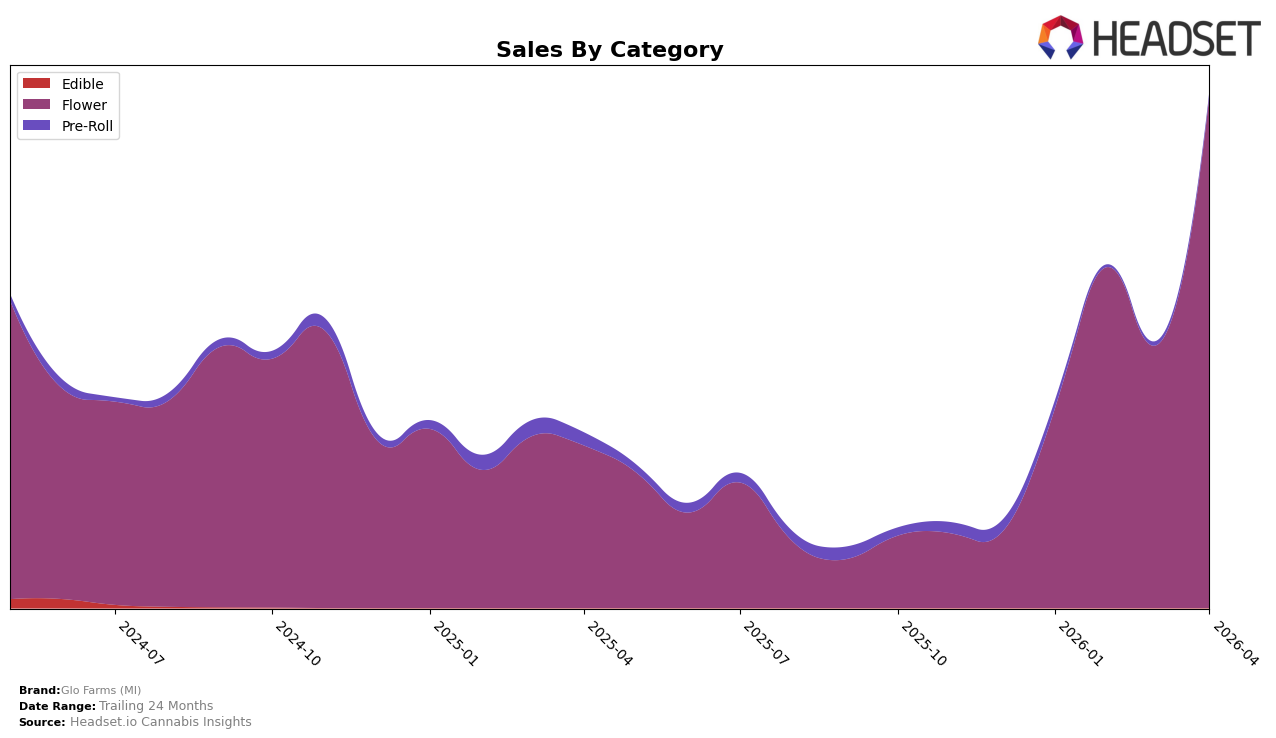
Glo Farms (MI) has shown a notable improvement in its performance within the Michigan flower category over the first four months of 2026. Starting the year ranked 33rd, the brand climbed to 18th in February, slipped slightly to 28th in March, but made an impressive recovery to reach the 12th spot by April. This upward trajectory is underscored by a significant increase in sales from January to April, indicating strong market acceptance and growth potential in Michigan's competitive cannabis industry. However, the initial position outside the top 30 in January suggests there was a need for strategic adjustments, which appear to have been successfully implemented as evidenced by the subsequent rankings.
In contrast, Glo Farms (MI)'s presence in New Jersey is less pronounced, as the brand did not make it into the top 30 flower brands during the first quarter of 2026. With a rank of 98 in January, the brand's challenge in securing a foothold in New Jersey's market is evident. This could point to either a highly competitive landscape or a need for enhanced brand visibility and distribution strategies in the state. The absence of rankings in the following months highlights an area of potential concern or opportunity, depending on the strategic moves Glo Farms (MI) decides to undertake to improve its market position.
Competitive Landscape
In the competitive landscape of Michigan's flower category, Glo Farms (MI) has shown a remarkable upward trajectory in recent months. Starting from a rank of 33 in January 2026, Glo Farms (MI) climbed to the 12th position by April 2026, indicating a significant improvement in market presence and consumer preference. This ascent is particularly notable when compared to competitors such as Common Citizen, which experienced a slight decline from 7th to 10th place over the same period. Meanwhile, Goldkine remained relatively stable, hovering around the 13th to 15th positions, and Glorious Cannabis Co. showed a consistent presence, moving from 25th to 14th. Loud Pax maintained a steady rank around the 11th position. Glo Farms (MI)'s rapid rise suggests a robust growth strategy and increasing consumer appeal, positioning it as a formidable player in the Michigan flower market.

Notable Products
In April 2026, Papa Smurf OG (3.5g) emerged as the top-performing product from Glo Farms (MI), achieving the number one rank with sales of $5305. Purple Dream (3.5g) followed closely in second place, showing a rise from its previous top position in March. Porn Nug (3.5g) maintained its consistent performance by holding the third rank for two consecutive months. Power Puff Girls (3.5g) secured the fourth spot, reflecting a steady performance despite a drop from its second rank in February. Unicorn Piss (3.5g) re-entered the rankings in fifth place after being unranked in February and March, indicating a resurgence in popularity.
Top Selling Cannabis Brands
Data for this report comes from real-time sales reporting by participating cannabis retailers via their point-of-sale systems, which are linked up with Headset’s business intelligence software. Headset’s data is very reliable, as it comes digitally direct from our partner retailers. However, the potential does exist for misreporting in the instance of duplicates, incorrectly classified products, inaccurate entry of products into point-of-sale systems, or even simple human error at the point of purchase. Thus, there is a slight margin of error to consider. Brands listed on this page are ranked in the top twenty within the market and product category by total retail sales volume.

