.svg)
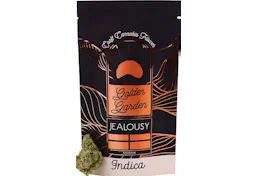


Where to Buy
Golden Garden is stocked at 187 licensed dispensaries across New York, with the deepest coverage in New York, Queens, Brooklyn, Staten Island, and Rochester. Search by ZIP code or city below to find the closest one, or filter by product type if you are after a specific format.
Market Insights Snapshot
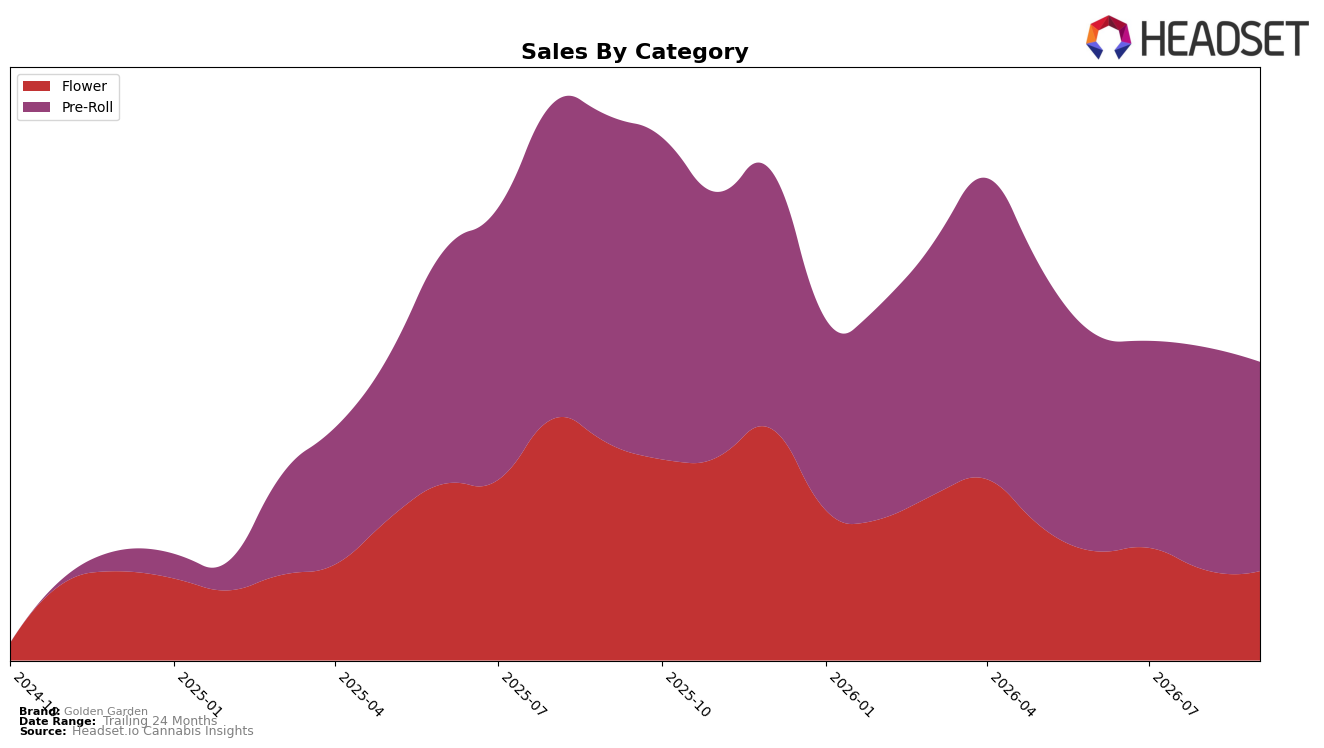
In September 2026, Golden Garden derived 70.09% of sales from Pre-Roll and 29.91% from Flower, with Pre-Roll down 36.22% year over year and 6.08% month over month, while Flower declined 58.87% year over year and 1.39% month over month. Despite a brand-level average price decrease of 11.28% and a Pre-Roll average price of $10.07, the steeper volume pressure in Flower at a 58.87% YoY drop versus Pre-Roll’s 36.22% YoY decline indicates that the category mix is concentrating toward lower-priced Pre-Rolls as Flower underperforms. The brand’s Pre-Roll rank position at 38 in New York alongside a 6.08% MoM Pre-Roll dip and a 1.39% MoM Flower dip implies near-term share risk is more acute in Pre-Roll than in Flower, even as Flower’s YoY collapse drives the long-run mix shift.
The mix tilt toward Pre-Roll at 70.09% share, combined with a 36.22% YoY decline versus Flower’s 58.87% YoY decline, suggests Golden Garden is being pulled into a value-leaning position where price and format convenience dominate. With brand sales down 45.24% year over year and the Pre-Roll rank at 38 in New York, the current profile points to a need for distinct Pre-Roll differentiation while shoring up Flower margins, since a 6.08% MoM fall in the core Pre-Roll engine alongside only a 1.39% MoM drop in Flower indicates incremental share defense will likely come from stabilizing Pre-Roll velocity rather than relying on a rapid Flower rebound.
Competitive Landscape
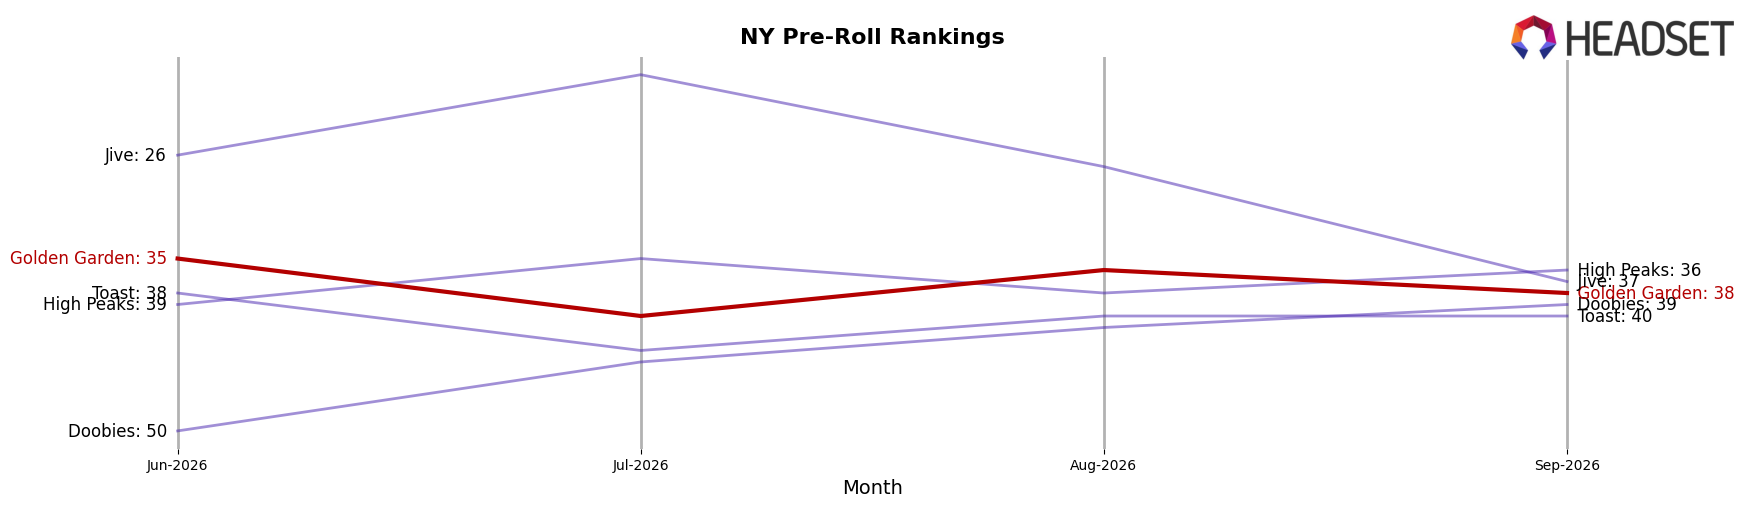
Golden Garden sits at rank #38 in NY Pre-Roll in September 2026, down 18 positions year over year from #20, and 3 spots below its June 2026 position at #35; the brand’s prior peak at #19 in April 2026 marks a 19-place slide from its best month to now. Meanwhile, Jeeter advanced from #6 to #2 year over year while growing sales by 122.5%, and PICC Platform jumped 54 ranks into #5 alongside a 919.6% sales increase, indicating that Golden Garden’s relative decline is occurring as faster-rising rivals consolidate top-tier positions. The pattern implies Golden Garden is ceding share-of-rank to high-velocity competitors and will need either mix changes or distribution gains to reverse a downward trajectory from April 2026’s #19 to September 2026’s #38.
Notable Products
Buckin Runtz Pre-Roll (1g) posted the steepest movement in September 2026 at -26.1% MoM, sliding within a top-five pack where Blue Zushi Pre-Roll (1g) fell -10.9% at rank 3 and Superboof Pre-Roll (1g) declined -8.2% at rank 2. Melted Strawberries Pre-Roll (1g) inched up +3.0% while holding rank 1, and London Pound Cake Pre-Roll (1g) advanced +25.3% at rank 4, but Dantes Inferno Pre-Roll (1g) contracted -30.3% at rank 6. With nine of the top ten as Pre-Roll SKUs and the sole Flower entry Superboof (3.5g) up +15.2% at rank 10 on approximately $23.9K, the mix skews toward Pre-Rolls but hints at selective upside in Flower. The pattern implies Golden Garden is consolidating Pre-Roll leadership while testing a lane for premium Flower that could diversify revenue if momentum sustains.
Top Selling Cannabis Brands






Data for this report comes from real-time sales reporting by participating cannabis retailers via their point-of-sale systems, which are linked up with Headset’s business intelligence software. Headset’s data is very reliable, as it comes digitally direct from our partner retailers. However, the potential does exist for misreporting in the instance of duplicates, incorrectly classified products, inaccurate entry of products into point-of-sale systems, or even simple human error at the point of purchase. Thus, there is a slight margin of error to consider. Brands listed on this page are ranked in the top twenty within the market and product category by total retail sales volume.

