.svg)

Sep-2026
Sales
Trend
6-Month
Product Count
SKUs
Avg Price
YoY Sales Change
YoY Price Change


Market Insights Snapshot
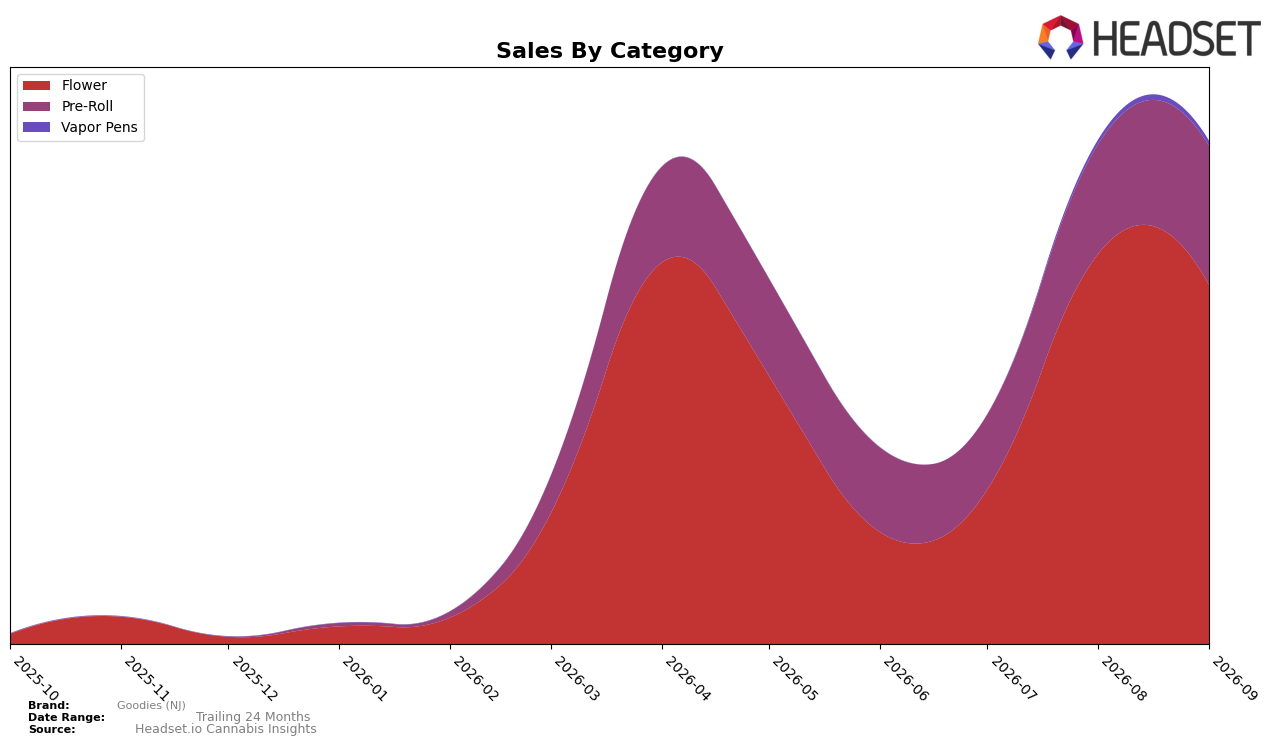
Goodies (NJ) concentrated 71.38% of September 2026 sales in Flower while Pre-Roll held 27.69% and Vapor Pens 0.94%, indicating a two-category core with a minimal third leg. Month over month, Flower contracted by 8.20% while Pre-Roll expanded by 26.99%, with Vapor Pens up 7.82%; combined, this shifted nearly a full tenth of mix points toward Pre-Roll without dislodging Flower as the largest line. In New Jersey Flower, the brand sat at rank 32, which, paired with a 59.82 average price in Flower versus a 22.39 average price in Pre-Roll, implies a portfolio tilting toward lower-ticket velocity as the month progressed.
The swing from an 8.20% decline in Flower against a 26.99% rise in Pre-Roll narrows reliance on a single category while keeping leverage in the Flower-heavy New Jersey market. With Flower still at 71.38% share and rank 32 in-state, the near-1 percentage point Vapor Pens presence and 7.82% month-over-month lift provide optionality but not material hedging yet; the pattern implies Goodies (NJ) is trading some premium-weighted Flower volume for faster-moving Pre-Roll turns to stabilize unit throughput and price ladders.
Competitive Landscape
Goodies (NJ) sits at rank #32 in NJ Flower in September 2026, improving 32 positions from June 2026’s #64, while peak rank also lands at #32 in September 2026; in contrast, Find. climbed to #1 with a 111.6% year-over-year sales increase as Ozone held #2 despite a -2.8% sales decline, and Good Green advanced to #3 with a 166.7% lift alongside RYTHM at #4 with -9.8% sales pressure; this step-change from #64 to #32, set against top-tier rivals moving up or slipping on double- and negative-digit sales swings, implies Goodies (NJ) is transitioning from peripheral share to mid-pack relevance, with momentum that will either consolidate or fade depending on whether the recent rank inflection sustains into the next quarter.

Notable Products
GO Pre-Roll 5-Pack (2.5g) posted the steepest movement in September 2026 with a -28.0% month-over-month drop and sat at rank 5, while Flow Pre-Roll 5-Pack (2.5g) in rank 1 inched up by 3.8% MoM. Slow Pre-Roll 5-Pack (2.5g) rose 15.1% MoM at rank 4, and Grandaddy Grape Infused Pre-Roll (1g) climbed 12.7% MoM at rank 7. Eight of the top ten are Pre-Roll SKUs, indicating mix concentration that prioritizes multi-pack and infused formats over Flower despite Fruit Fizz (14g) anchoring rank 8 with $21,891 in sales; this tilt implies Goodies (NJ) is leaning into repeatable, sessionable Pre-Roll demand even as single large-format Flower holds a secondary lane.
Top Selling Cannabis Brands






Data for this report comes from real-time sales reporting by participating cannabis retailers via their point-of-sale systems, which are linked up with Headset’s business intelligence software. Headset’s data is very reliable, as it comes digitally direct from our partner retailers. However, the potential does exist for misreporting in the instance of duplicates, incorrectly classified products, inaccurate entry of products into point-of-sale systems, or even simple human error at the point of purchase. Thus, there is a slight margin of error to consider. Brands listed on this page are ranked in the top twenty within the market and product category by total retail sales volume.

