Market Insights Snapshot
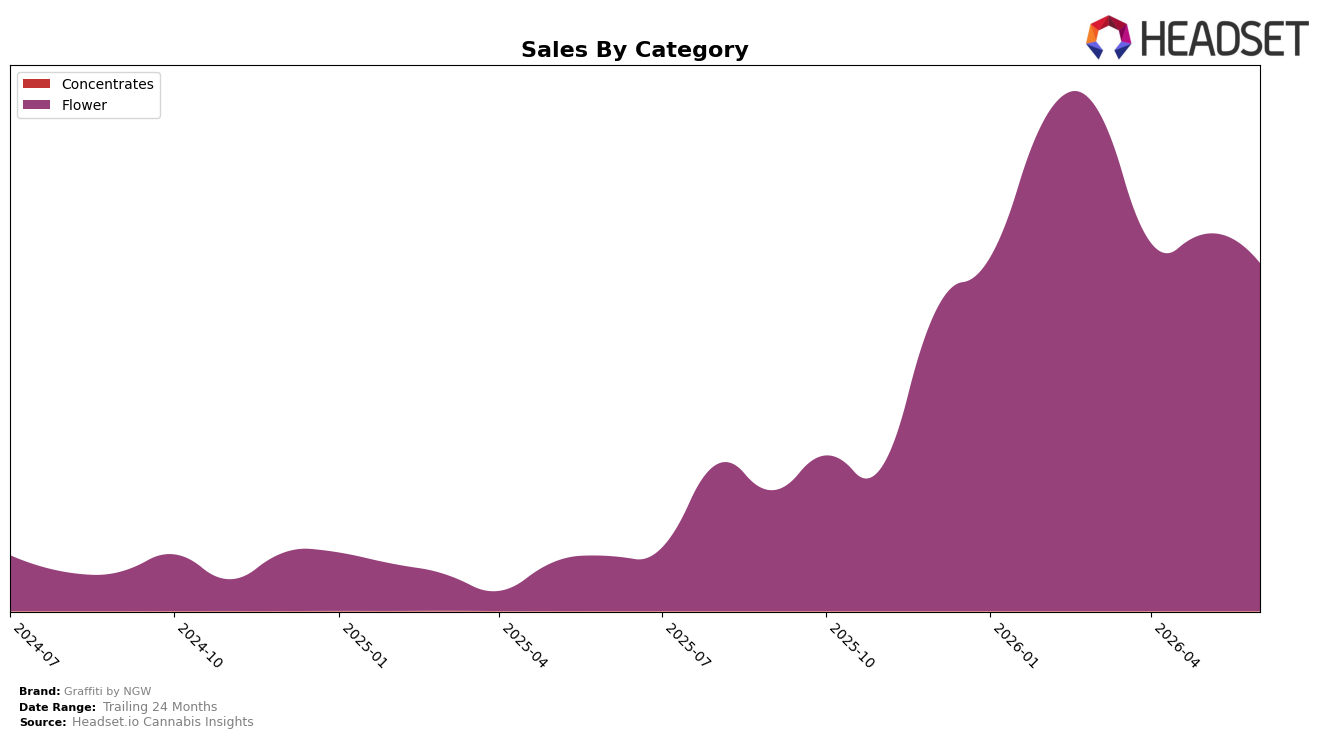
In June 2026, Graffiti by NGW operated as a single-category brand, with Flower contributing 100.0% of sales and averaging $32.32 per unit, while year-over-year sales rose 536.5% and month-over-month sales declined 7.7%. Despite a 0.38% YoY decrease in average price, the brand held rank 27 within Flower in Illinois, indicating that the category mix is concentrated and scale gains are driven by volume rather than pricing. The pattern implies that growth is being pulled by a narrow Flower-led engine that is sensitive to monthly volatility, which limits buffer against category shocks but accelerates share capture when Flower demand expands.
The combination of a 536.5% YoY sales surge alongside a 7.7% MoM step-down and rank 27 in Illinois positions Graffiti by NGW as a volume challenger in Flower, trading a 0.38% YoY price compression for throughput. With 100.0% of sales tied to Flower and no diversification into other categories, the brand’s competitive posture hinges on sustaining unit momentum at roughly the $32 price point while navigating rank mobility around the mid-to-late 20s. The implication is that near-term share advances will depend more on consistent replenishment and strain breadth than on price lifts, because the current mix and rank suggest elasticity-driven unit capture rather than premium-tier pricing power.
Competitive Landscape
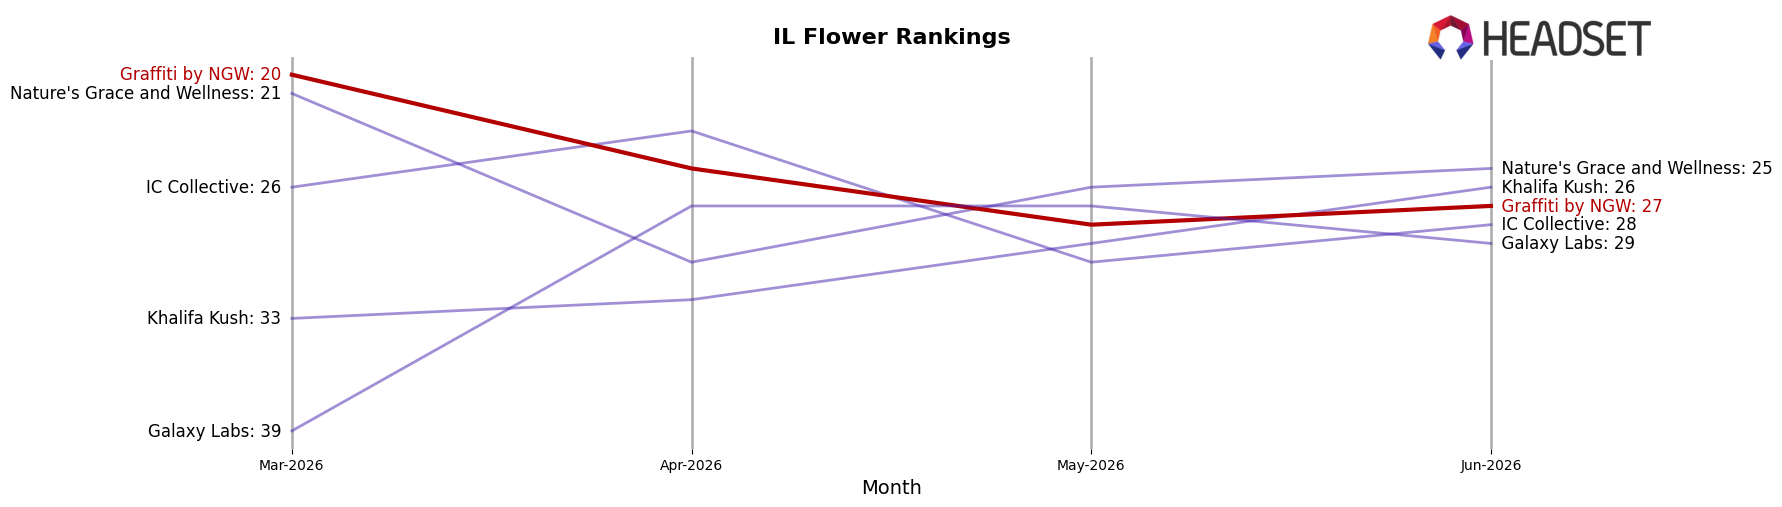
Graffiti by NGW sits at rank #27 in IL Flower in June 2026 after improving 34 positions from #61 year over year, though it slipped 7 spots from #20 in March 2026 to #27 by June 2026; against that backdrop, High Supply / Supply held #1 with a 32.1% YoY sales increase while RYTHM stayed at #2 despite a 5.2% YoY decline, indicating Graffiti by NGW is gaining relative rank against mixed top-tier momentum but losing short-term position within the quarter. Compared with Good Green climbing from #4 to #3 on 30.9% YoY growth and Simply Herb easing from #3 to #4 alongside a 16.8% YoY decline, Graffiti by NGW’s recovery from #61 to #27 but retreat from its March 2026 peak of #20 implies a mid-pack rebound that needs consistent monthly execution to convert annual gains into sustained top-20 presence.
Notable Products
Side Piece (1g) posted the standout move in June 2026 with a 54.5% month-over-month gain and a jump to rank 1, while Raspberry Slapcake (1g) fell 40.9% to rank 3 and Trixie's Inferno (3.5g) declined 47.0% to rank 4. Double Durban Kush (3.5g) also slipped 11.3% to rank 5 as Purp Skurp Shake (7g) dropped 12.2% to rank 7, and four of the top ten are Flower SKUs concentrated in 3.5g and 7g formats. The $42,839 performance of Hybrid Mixed Buds Popcorn (14g) at rank 2 with no prior baseline hints at trial-driven volume while legacy 3.5g units retrench. The pattern implies Graffiti by NGW is tilting mix toward value-oriented sizes and a breakout 1g headline SKU while rationalizing mid-size 3.5g offerings.
Top Selling Cannabis Brands
Data for this report comes from real-time sales reporting by participating cannabis retailers via their point-of-sale systems, which are linked up with Headset’s business intelligence software. Headset’s data is very reliable, as it comes digitally direct from our partner retailers. However, the potential does exist for misreporting in the instance of duplicates, incorrectly classified products, inaccurate entry of products into point-of-sale systems, or even simple human error at the point of purchase. Thus, there is a slight margin of error to consider. Brands listed on this page are ranked in the top twenty within the market and product category by total retail sales volume.

