.svg)

Sep-2026
Sales
Trend
6-Month
Product Count
SKUs
Avg Price
YoY Sales Change
YoY Price Change


Where to Buy
Green Gold Group (MA) is stocked at 66 licensed dispensaries across Massachusetts, with the deepest coverage in Boston, Brockton, Fall River, Haverhill, and Northampton. Search by ZIP code or city below to find the closest one, or filter by product type if you are after a specific format.
Market Insights Snapshot
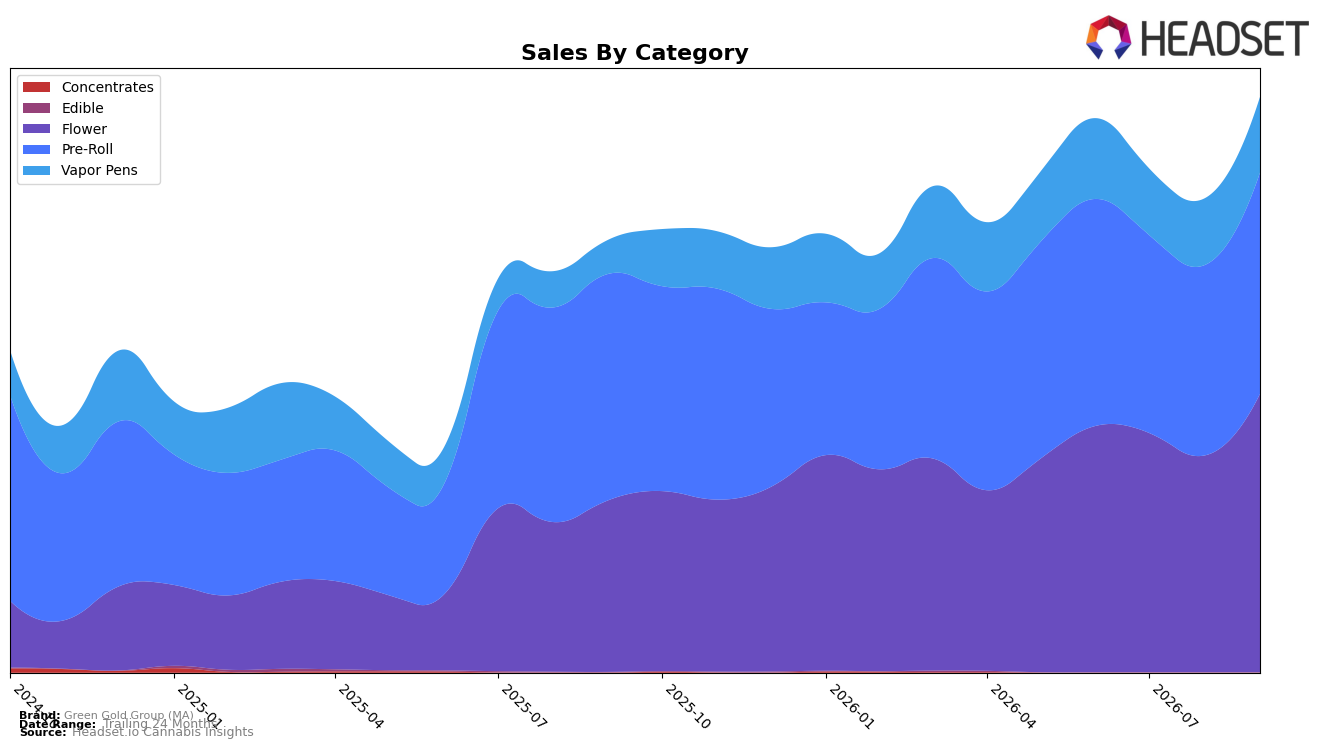
In September 2026, Green Gold Group (MA) concentrated 48.40% of sales in Flower with year-over-year growth of 62.32% and month-over-month growth of 28.43%, while Pre-Roll held 38.47% share with a -2.25% year-over-year change and a 16.27% month-over-month lift. Vapor Pens represented 13.13% share with a 122.59% year-over-year increase and a 13.42% month-over-month rise, and the brand’s overall average price fell 11.91% year-over-year alongside total brand sales up 33.10% year-over-year. With Flower ranked 28 in Massachusetts during September 2026 and Pre-Roll showing mixed momentum, the pattern implies the brand is reallocating demand toward higher-velocity inhalables while discounting to expand volume.
The mix shift—Flower up 28.43% month-over-month versus Vapor Pens up 13.42% month-over-month, and Flower at 62.32% year-over-year versus Pre-Roll at -2.25% year-over-year—suggests the brand’s near-term positioning leans on Flower to drive traffic while Vapor Pens supply incremental growth. Given a 33.10% year-over-year sales increase alongside an 11.91% average price decrease and a 122.59% Vapor Pens surge, the thesis is that Green Gold Group (MA) is trading price for share in core inhalables to climb from a 28th-place Flower position in Massachusetts, using Flower for scale and Vapor Pens for ticket expansion.
Competitive Landscape
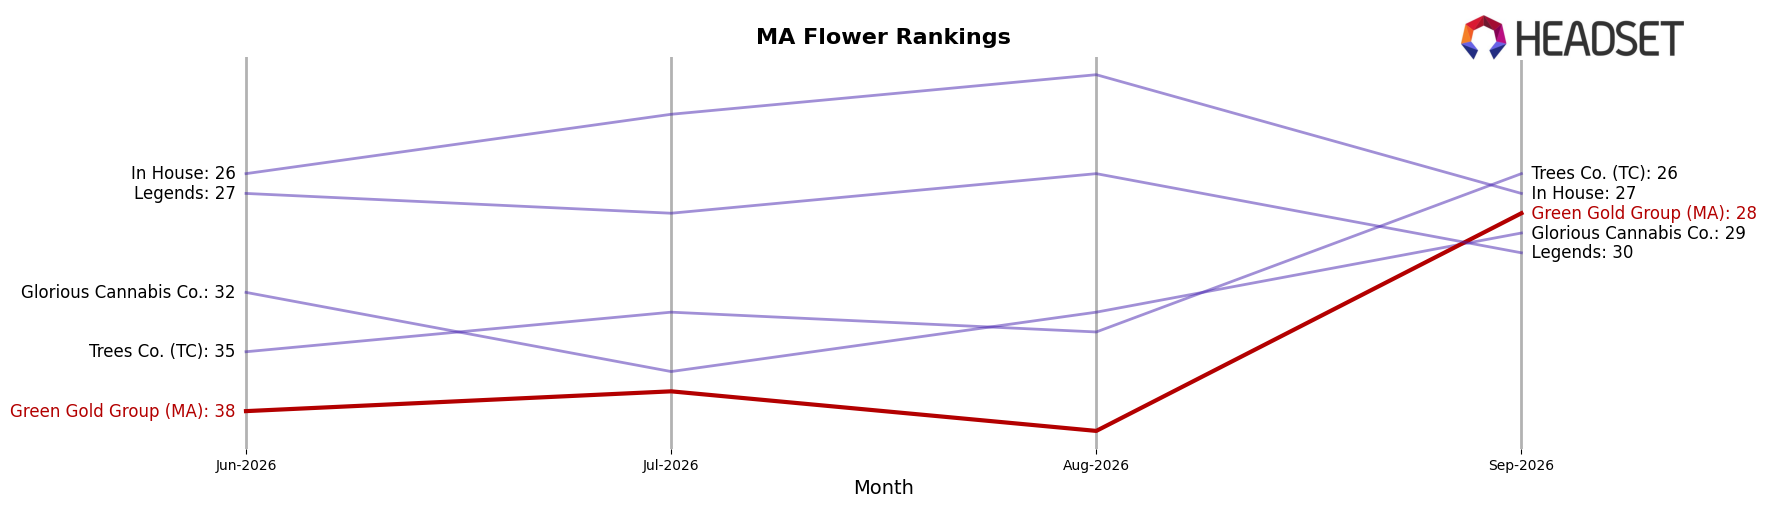
Green Gold Group (MA) sits at rank #28 in MA Flower in September 2026, climbing 22 positions from #50 year over year and improving 10 spots from #38 since June 2026; this new peak rank of #28 in September 2026 coincides with a year-over-year shift that contrasts with Perpetual Harvest rising from #4 to #1 on 124.1% YoY sales growth and Simply Herb sliding from #1 to #3 alongside a -16.6% YoY sales change. Against the broader top-five mix where Farmer's Cut held #2 from #2 with 37.5% YoY growth and High Supply / Supply eased from #3 to #4 amid a -13.6% YoY decline, Green Gold Group (MA)’s 22-rank YoY ascent and 10-rank three-month gain indicate momentum into the mid-tier, implying the brand is transitioning from peripheral presence to credible contention for top-20 placement if the current climb persists.
Notable Products
Platinum Gorilla Pre-Roll (1g) posted the standout move in September 2026 with a +113.9% month-over-month surge to $35,463 and seized rank 1, while Super Silver Glue Pre-Roll (1g) slid -43.9% at rank 8 and Commando Pre-Roll (1g) fell -17.5% at rank 10. Jungle Breath Pre-Roll (1g) advanced +63.9% to rank 2, and Jungle Breath (3.5g) climbed +65.1% at rank 5, indicating demand is tilting toward SKUs with the Jungle Breath lineage. With eight of the top ten products in September 2026 in the Pre-Roll category and two of those showing declines below -10% alongside two gains above +60%, volatility is concentrating within a single format rather than spreading across categories. The mix implies Green Gold Group (MA) is leaning into Pre-Rolls as the commercial engine while using Flower as a complementary upsell, creating higher peak potential but exposing monthly share to sharper swings within one category.
Top Selling Cannabis Brands






Data for this report comes from real-time sales reporting by participating cannabis retailers via their point-of-sale systems, which are linked up with Headset’s business intelligence software. Headset’s data is very reliable, as it comes digitally direct from our partner retailers. However, the potential does exist for misreporting in the instance of duplicates, incorrectly classified products, inaccurate entry of products into point-of-sale systems, or even simple human error at the point of purchase. Thus, there is a slight margin of error to consider. Brands listed on this page are ranked in the top twenty within the market and product category by total retail sales volume.

