Jun-2026
Sales
Trend
6-Month
Product Count
SKUs
Avg Price
YoY Sales Change
YoY Price Change
Market Insights Snapshot
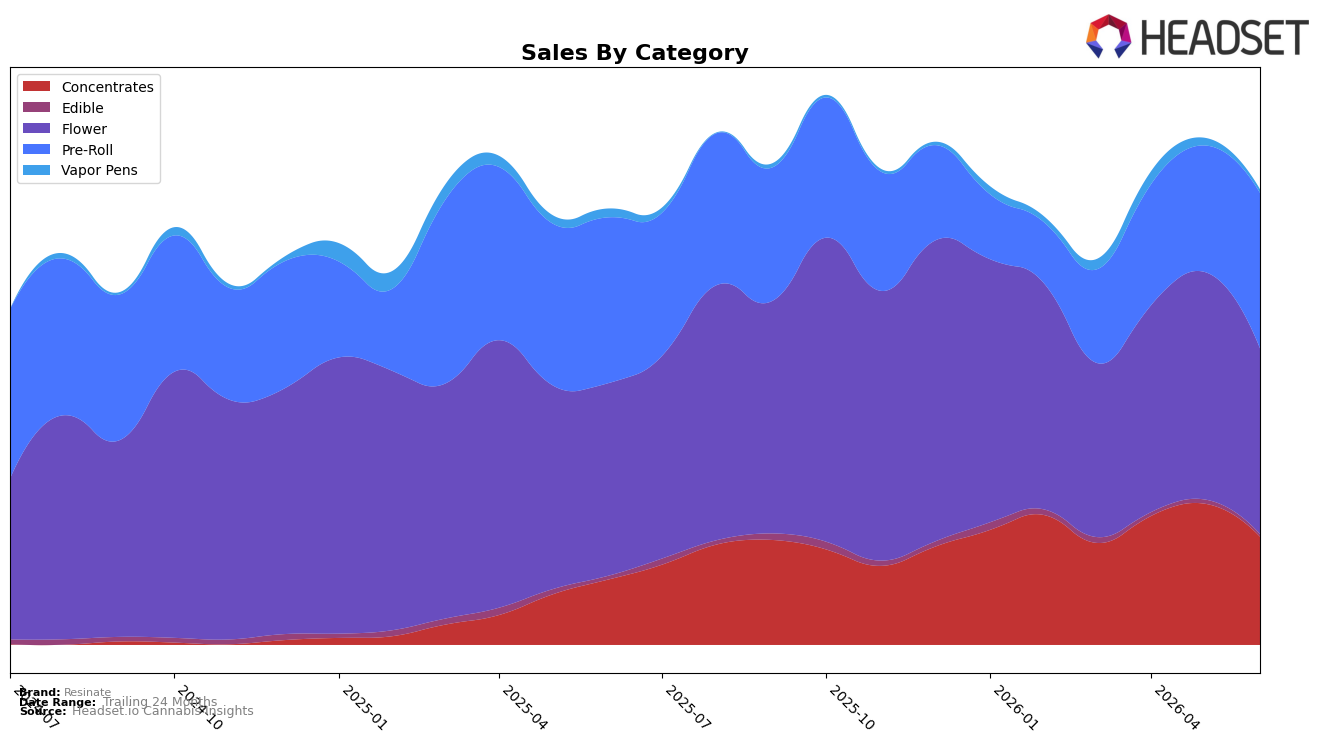
In June 2026, Resinate’s category mix tilted toward Flower at 40.52% share with year-over-year contraction of 3.55% and a month-over-month drop of 18.29%, while Pre-Roll held 33.96% share with a 6.22% YoY decrease but a 22.72% MoM lift. Concentrates expanded YoY by 64.55% to 23.72% share yet fell 23.19% MoM, and smaller lines compressed with Vapor Pens down 52.85% YoY and 46.68% MoM at 1.01% share, and Edible down 23.71% YoY and 29.73% MoM at 0.80% share. With overall brand sales up 4.37% YoY and average price down 1.05% YoY, the mix indicates volume support from lower pricing alongside a pivot toward a three-pillar portfolio where Pre-Roll volatility offsets Flower declines and Concentrates carry the growth delta.
The mix shift implies a positioning anchored in Massachusetts Flower as the lead traffic driver but increasingly dependent on Concentrates for growth, which helps mitigate price pressure while Pre-Roll provides near-term acquisition via MoM gains of 22.72% against Flower’s 18.29% MoM decline. At the same time, a 64.55% YoY surge in Concentrates paired with a 52.85% YoY decline in Vapor Pens signals a deliberate trade-up within inhalables, and the brand’s rank of 45 in Massachusetts Flower constrains share capture unless the Flower decline of 3.55% YoY is stabilized. Net, Resinate’s defensible path is to lean on Concentrates growth to backfill Flower softness while using Pre-Roll momentum to maintain shopper flow, positioning the brand toward potency-forward value rather than breadth across lagging Edible and Vapor Pens segments.
Competitive Landscape
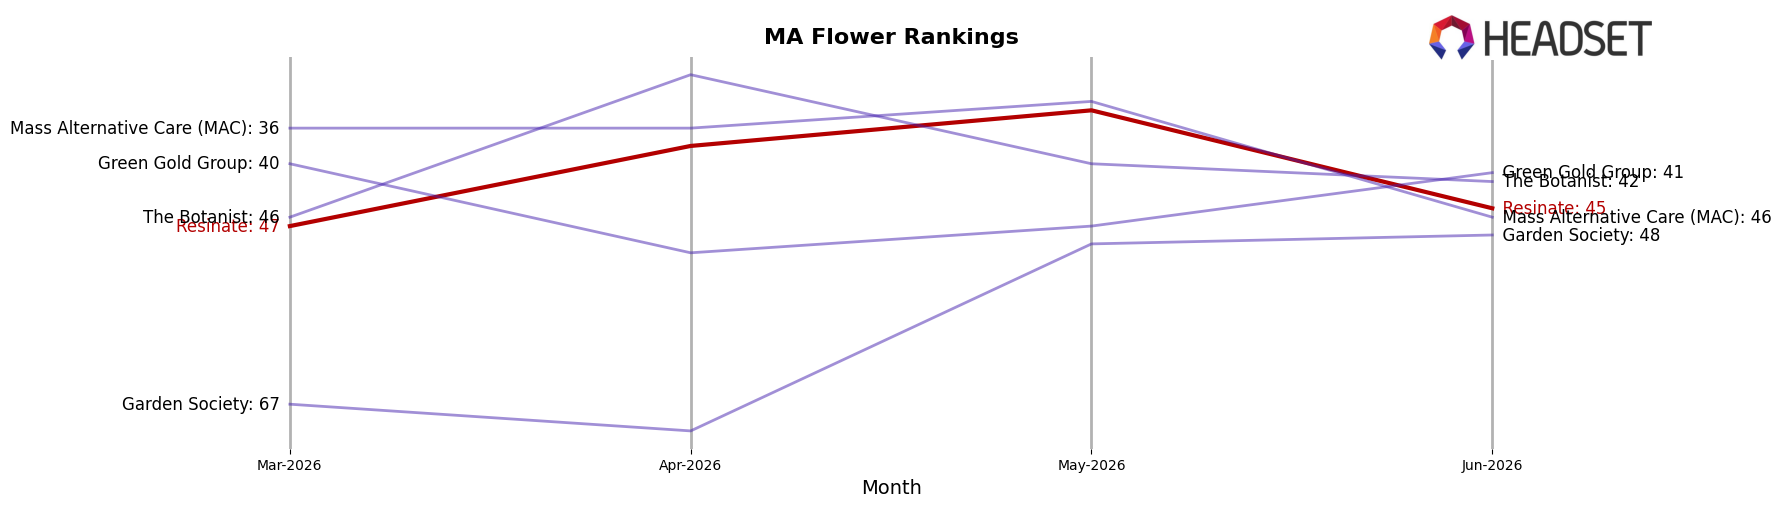
Resinate is currently ranked #45 in Massachusetts Flower, down 3 spots year over year from #42 and up 2 spots from #47 versus March 2026, while the brand’s peak of #25 in December 2025 underscores a 20-rank slide since that high-water mark; in contrast, Farmer's Cut moved from #3 to #1 with 32.4% year-over-year sales growth and Root & Bloom jumped from #16 to #5 alongside 158.9% growth, indicating competitors are consolidating share as Resinate drifts from prior placement. The mix of a modest quarter-over-quarter lift in June 2026 rank and a year-over-year decline points to a stabilization phase off a lower base, implying that without a decisive share-capture move against rising leaders, the most likely trajectory is mid-40s persistence rather than a return toward the #25 peak.
Notable Products
Lemon Haze Pre-Roll (1g) posted the headline move in June 2026 with a +54.7% month-over-month surge, landing at rank 5 while Blue Dream Pre-Roll (1g) held rank 1 despite a -7.3% decline. Strawberry Banana Lemon Pre-Roll (1g) slid -16.6% to rank 3, and Socrates Sour (3.5g) fell -38.4% to rank 9, signaling pressure on Flower even as Pre-Rolls concentrated eight of the top ten slots. Socrates Sour Pre-Roll (1g) advanced +24.1% at rank 2 alongside a single Flower SKU above $46,000, implying the mix is tilting toward Pre-Rolls for volume while Flower skews to fewer, higher-ticket bets.
Top Selling Cannabis Brands
Data for this report comes from real-time sales reporting by participating cannabis retailers via their point-of-sale systems, which are linked up with Headset’s business intelligence software. Headset’s data is very reliable, as it comes digitally direct from our partner retailers. However, the potential does exist for misreporting in the instance of duplicates, incorrectly classified products, inaccurate entry of products into point-of-sale systems, or even simple human error at the point of purchase. Thus, there is a slight margin of error to consider. Brands listed on this page are ranked in the top twenty within the market and product category by total retail sales volume.

