.svg)
Sep-2026
Sales
Trend
6-Month
Product Count
SKUs
Avg Price
YoY Sales Change
YoY Price Change


Where to Buy
Green Haven is stocked at 56 licensed dispensaries across Washington and Nevada, 44 of them in Washington, with the deepest coverage in Seattle, Olympia, Bellingham, Everett, and Lacey. Search by ZIP code or city below to find the closest one, or filter by product type if you are after a specific format.
Market Insights Snapshot
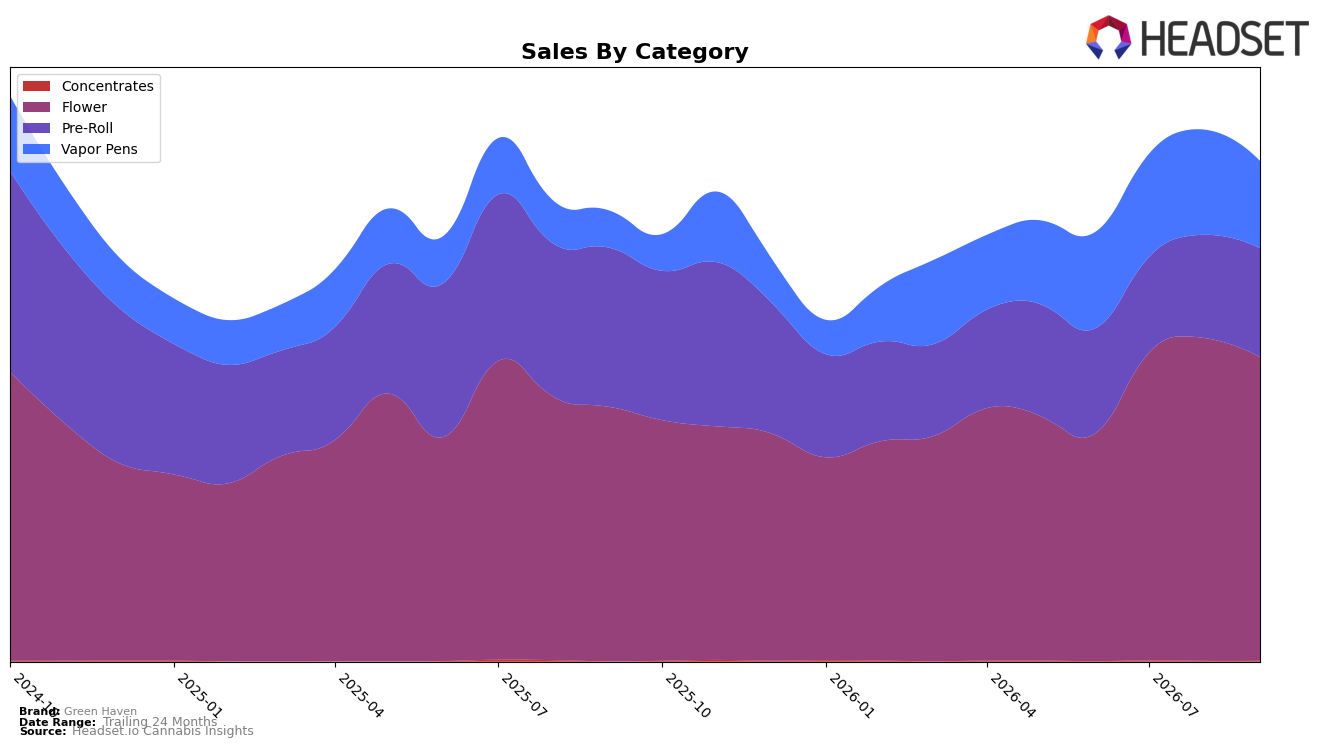
In September 2026, Green Haven’s mix centered on Flower at 60.72% share with 19.35% year-over-year growth but a 5.93% month-over-month decline, while Vapor Pens held 17.42% share with 134.88% year-over-year growth and a 16.97% month-over-month decline; Pre-Roll accounted for 21.73% share with a 31.68% year-over-year decline and a 5.49% month-over-month increase, and Concentrates sat at 0.12% share with 409.85% year-over-year growth and a 14.20% month-over-month increase. Against a 12.22% year-over-year rise in average price and 10.95% brand-level year-over-year sales growth, the mix implies margin lift concentrated in higher-priced Flower at $25.48 and a volatility drag from Vapor Pens, so the thesis is that September 2026 marked a price-led Flower anchor with countervailing short-term softness in inhalables.
Positioning-wise, a 36 rank in Flower in Washington alongside a 5.93% month-over-month contraction in Flower and a 16.97% month-over-month dip in Vapor Pens suggests reliance on a category that can support price but not near-term volume momentum, while a 5.49% month-over-month recovery in Pre-Roll and a 14.20% month-over-month lift in Concentrates indicate incremental share protection at the value and niche edges. With Vapor Pens surging 134.88% year-over-year but sliding month-over-month and Pre-Roll down 31.68% year-over-year despite a recent uptick, the thesis is that Green Haven’s defensible stance is as a Flower-first brand that uses selective promo or format breadth to smooth volatility rather than chase rapid share reallocation.
Competitive Landscape
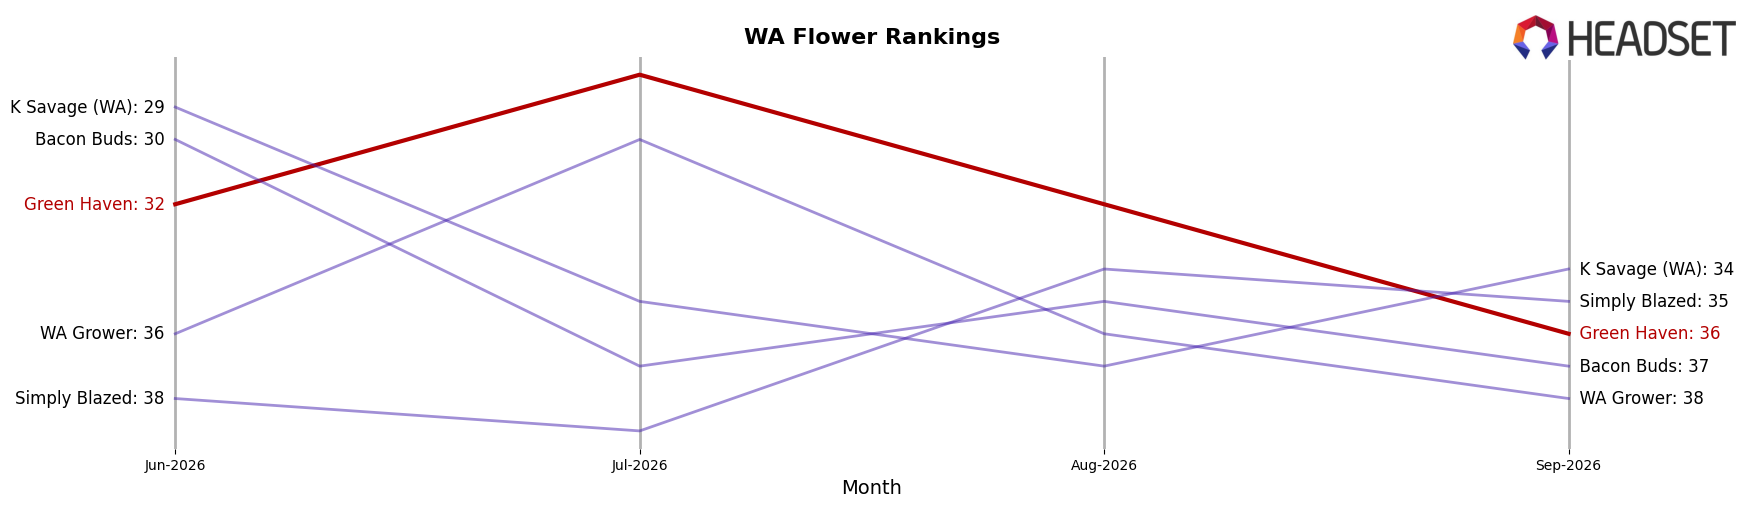
Green Haven sits at rank #36 in WA Flower in September 2026, down 3 positions year over year from #33 and 4 spots below its June-to-September three-month mark of #32, while also trailing its July 2026 peak of #28 by 8 ranks; in contrast, Phat Panda held #1 both this September and a year earlier with year-over-year sales up 18.99%, and Hemp Kings surged from #24 a year ago to #5 with 105.09% year-over-year sales growth. With Mama J's improving from #4 to #3 alongside 3.16% growth and Lifted Cannabis Co moving from #6 to #4 on 6.27% growth, the directional gap suggests Green Haven’s slide from #28 in July 2026 to #36 in September 2026 is more about losing relative velocity than a short-term fluctuation, implying that without a share-accretive move the brand is set to drift further down the mid-tier ranks.
Notable Products
Wedding Cake Distillate Disposable (1g) posted the steepest movement in September 2026 with a -37.7% month-over-month change while sitting at rank 7, and Thai Stick Infused Pre-Roll 2-Pack (1g) also contracted by -34.4% at rank 9; by contrast, Where's My Bike ? (3.5g) rose 32.6% to rank 2. Pre-Rolls account for six of the top ten SKUs, yet the flagship Thai Stick Infused Pre-Roll (1g) dipped -4.9% at rank 1 while Thai Stick Infused Pre-Roll 4-Pack (2g) inched up 2.3% at rank 10, indicating consumer rotation within format rather than category exit. With Amnesia Haze Distillate Disposable (1g) up 23.4% at rank 4 even as Blueberry Muffin Distillate Disposable (1g) slipped -4.3% at rank 8 and Wedding Cake Distillate Disposable (1g) fell sharply to $6,373, the vapor pen performance hinges on a narrower set of winning SKUs. The mix implies Green Haven’s near-term commercial direction favors a concentrated bet on the Where's My Bike family and a rationalization of underperforming vapor pen and Thai Stick multipack variants to protect rank velocity.
Top Selling Cannabis Brands






Data for this report comes from real-time sales reporting by participating cannabis retailers via their point-of-sale systems, which are linked up with Headset’s business intelligence software. Headset’s data is very reliable, as it comes digitally direct from our partner retailers. However, the potential does exist for misreporting in the instance of duplicates, incorrectly classified products, inaccurate entry of products into point-of-sale systems, or even simple human error at the point of purchase. Thus, there is a slight margin of error to consider. Brands listed on this page are ranked in the top twenty within the market and product category by total retail sales volume.

