Jun-2026
Sales
Trend
6-Month
Product Count
SKUs
Avg Price
YoY Sales Change
YoY Price Change
Market Insights Snapshot
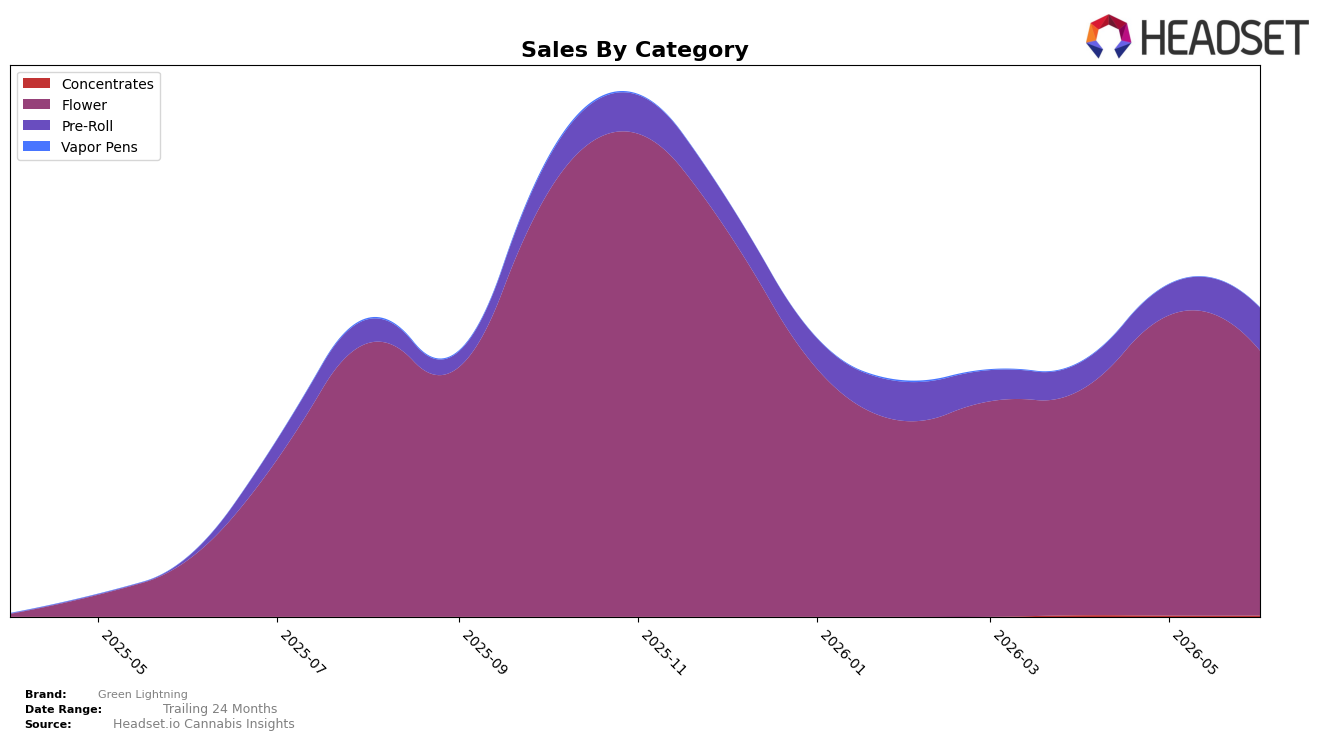
In June 2026, Green Lightning concentrated 85.77% of sales in Flower with a 362.53% year-over-year gain but an 11.81% month-over-month decline, while Pre-Roll held 13.82% share with a 1,387.25% year-over-year increase and a 39.40% month-over-month rise; Concentrates remained a 0.42% niche with a 2.67% month-over-month uptick and no comparable year-over-year baseline. Despite a 35.41% year-over-year drop in average price to $30.99, the overall brand posted 413.56% year-over-year sales growth, and ranked 11 in Flower within New Jersey, implying mix expansion is cushioning price compression while month-over-month softness in Flower tempers June momentum.
The mix shift toward Pre-Roll—up 39.40% month over month to 13.82% share alongside an 11.81% month-over-month decline in Flower—signals a repositioning toward lower-price-entry formats, reinforced by a 35.41% year-over-year average price decline and a Flower average price of $39.49 versus $13.30 in Pre-Roll. With 413.56% year-over-year brand growth anchored by Flower’s 362.53% increase yet complemented by a 1,387.25% surge in Pre-Roll, the pattern implies Green Lightning is using Pre-Roll to acquire volume and stabilize share while Flower’s 11 rank in New Jersey sets the near-term ceiling unless month-over-month Flower declines reverse.
Competitive Landscape
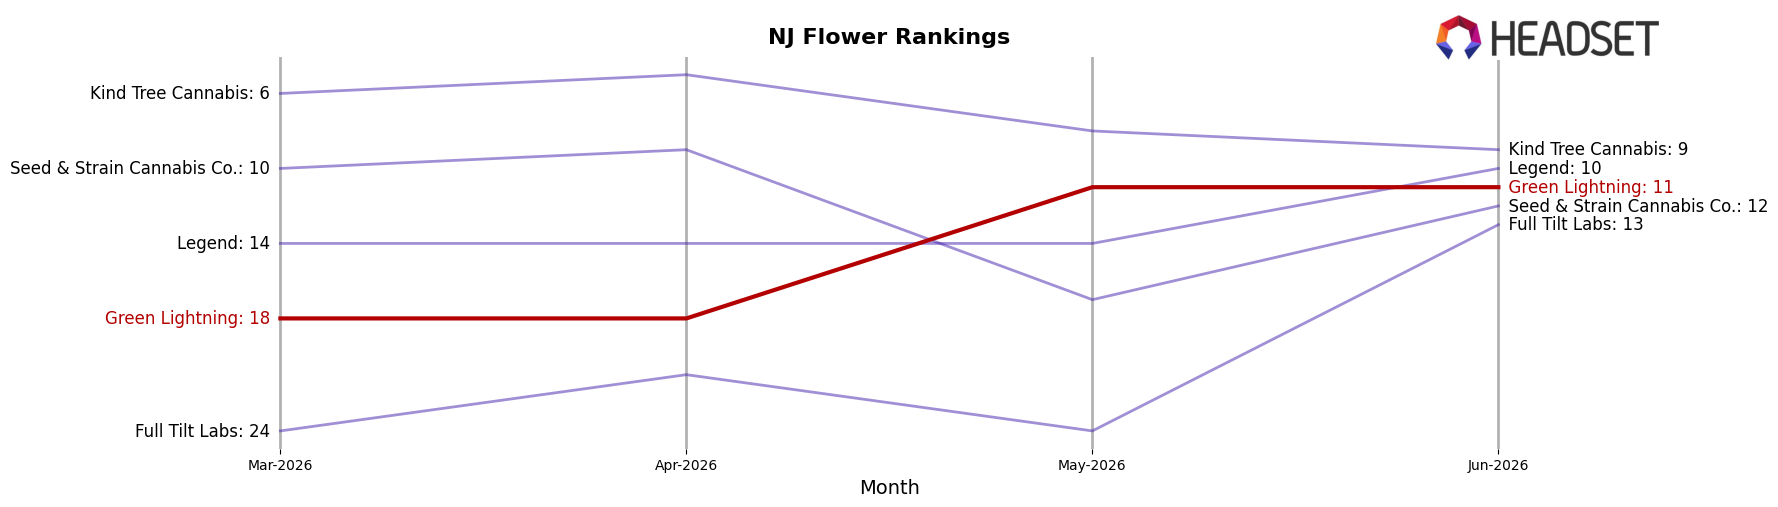
Green Lightning sits at rank #11 in NJ Flower in June 2026 after climbing 26 positions year over year from #37, and it improved 7 spots versus March 2026 when it was #18; the brand’s peak of #7 in December 2025 frames a mid-year pullback of 4 ranks from that high. Against this backdrop, Find. vaulted to #1 from #12 year over year while posting a 225.99% sales increase, and Ozone held at #2 from #2 despite a 10.61% sales decline, indicating that Green Lightning’s ascent is occurring amid both rapid share capture at the top and softening just below, implying a trajectory toward the top 10 that will require regaining 4 ranks to match its December 2025 peak and outpacing peers with double-digit gains.
Notable Products
Black Maple (3.5g) posted the standout movement in June 2026 with a +60.7% month-over-month surge to rank 2, while Chimax (3.5g) held rank 1 with a smaller +11.1% lift. In contrast, Han Solo Burger (3.5g) fell 39.2% and GAK Smalls (3.5g) declined 23.8%, both remaining in the top 10 but signaling volatility within Flower. With six of the top ten SKUs in the Flower category and only one Pre-Roll cracking the top three, the mix points to a Flower-led strategy concentrating volume in a few high-velocity eighths rather than diversifying across formats.
Top Selling Cannabis Brands
Data for this report comes from real-time sales reporting by participating cannabis retailers via their point-of-sale systems, which are linked up with Headset’s business intelligence software. Headset’s data is very reliable, as it comes digitally direct from our partner retailers. However, the potential does exist for misreporting in the instance of duplicates, incorrectly classified products, inaccurate entry of products into point-of-sale systems, or even simple human error at the point of purchase. Thus, there is a slight margin of error to consider. Brands listed on this page are ranked in the top twenty within the market and product category by total retail sales volume.

