.svg)

Jun-2026
Sales
Trend
6-Month
Product Count
SKUs
Avg Price
YoY Sales Change
YoY Price Change


Where to Buy
Grimas is stocked at 171 licensed dispensaries across Michigan, with the deepest coverage in Detroit, New Buffalo, Monroe, Flint, and Inkster. Search by ZIP code or city below to find the closest one, or filter by product type if you are after a specific format.
Market Insights Snapshot
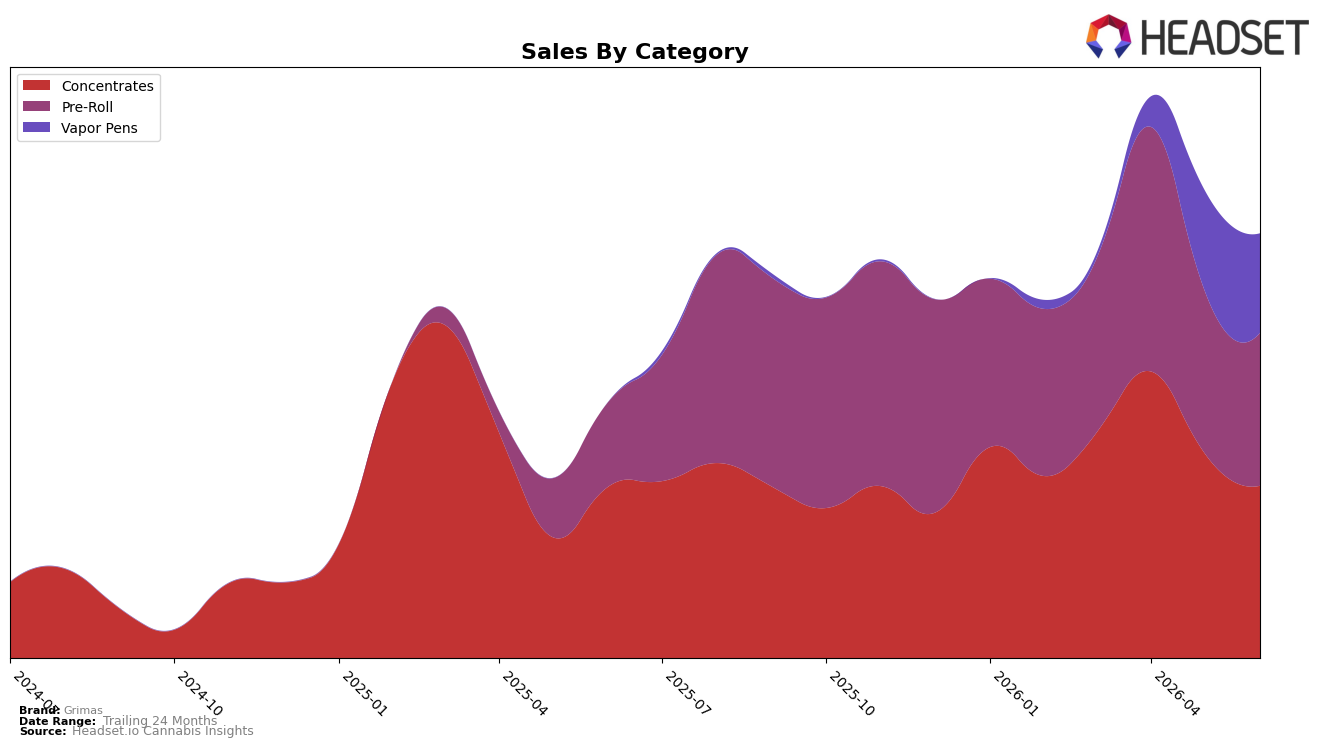
Grimas concentrated its June 2026 mix in Concentrates at 40.60% share with a 54.80% year-over-year lift but a 15.87% month-over-month pullback, while Pre-Roll held 35.99% share with 80.80% YoY growth and a 5.98% MoM decline; Vapor Pens rounded out 23.41% share with a 0.98% MoM dip and no YoY baseline reported. Despite a 65.89% brand-level YoY sales increase and a 35.19% YoY rise in average price to $10.49, the top state Michigan context places Grimas at rank 29 in Concentrates, indicating the category is a volume anchor even as short-term MoM softness and price mix create near-term friction; the pattern implies reliance on two growth engines (Concentrates and Pre-Roll) with simultaneous monthly cooling that could pressure momentum if unmanaged.
The mix shift—with Concentrates still the largest at 40.60% but falling 15.87% MoM, and Pre-Roll growing 80.80% YoY while slipping 5.98% MoM—positions Grimas as a value-to-potency hybrid brand where category breadth offsets volatility, yet rank 29 in Concentrates signals limited headroom without deeper penetration or trade-up. Given Vapor Pens’ 23.41% share and only a 0.98% MoM decline alongside a 35.19% YoY price increase at the brand level, the implication is that sustaining share will depend on stabilizing Concentrates velocity while nudging higher-priced, higher-ASP formats to absorb price-led gains without eroding unit throughput.
Competitive Landscape
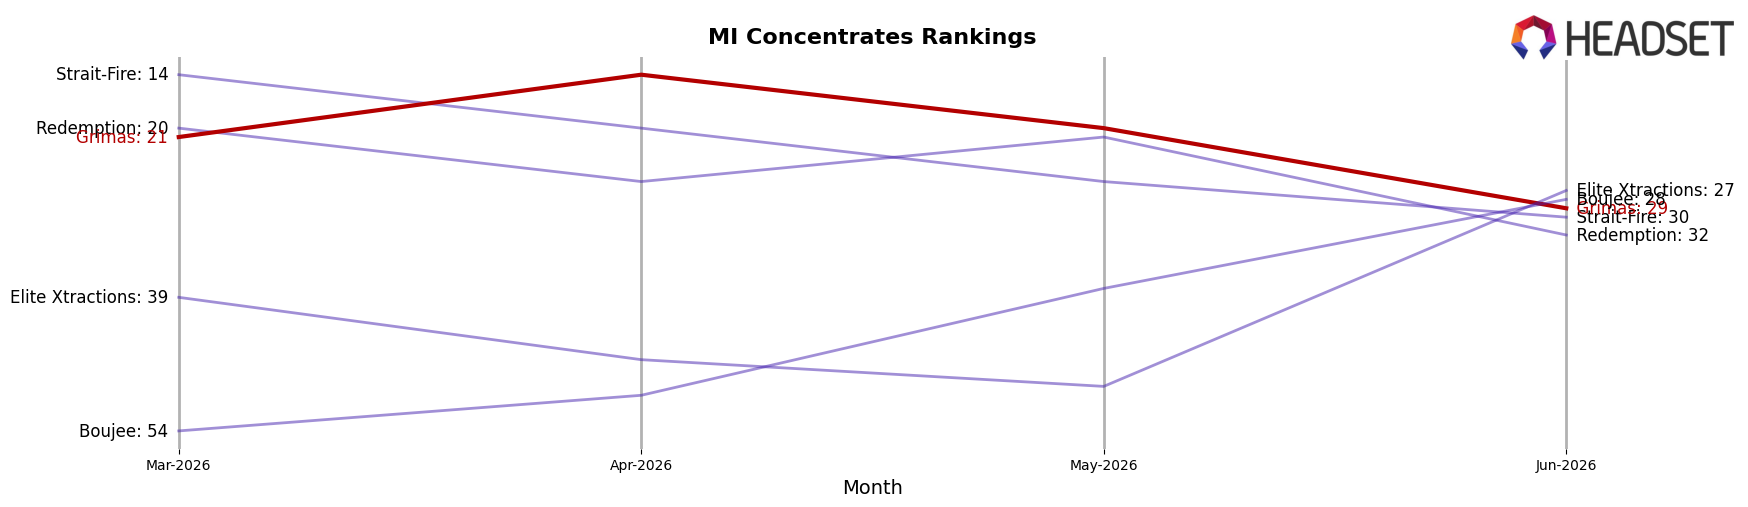
Grimas sits at rank #29 in MI Concentrates in June 2026, down 8 places year over year from #21, and 8 places below its March-to-June three-month position of #21; this follows a peak of #14 in April 2026 before sliding to #29 by June 2026. In directional contrast, The Limit held #1 with a YoY position change of 0 to #1 while Uniq Pressure surged from #133 to #4, indicating a rapid upward displacement against mid-pack brands. The combination of an April 2026 peak at #14 and an 8-place YoY decline to #29 implies that Grimas’s trajectory is one of midyear fade as faster-rising competitors compress share in the tier just outside the top 10.
Notable Products
Pink Starburst Infused Pre-Roll (1.5g) surged 227% month over month to rank 1 and generate $32,157, while Watermelon Splash Infused Pre-Roll (1.5g) slid 49% to rank 5, indicating a sharp reallocation of demand toward one hero SKU and away from mid-pack flavors. Crunch Berries Infused Pre-Roll (1.5g) climbed 69% to rank 2 as Baja Blast Infused Pre-Roll (1.5g) dipped 3% at rank 3, suggesting momentum is concentrating at the top rather than broad-based across the lineup. With all ten top products in Pre-Roll and two debuts entering at ranks 7 and 10, the assortment is narrowing around infused 1.5g formats even as several SKUs fell between 37% and 49%, implying Grimas is tilting toward fewer, higher-velocity winners over a wider flavor spread.
Top Selling Cannabis Brands






Data for this report comes from real-time sales reporting by participating cannabis retailers via their point-of-sale systems, which are linked up with Headset’s business intelligence software. Headset’s data is very reliable, as it comes digitally direct from our partner retailers. However, the potential does exist for misreporting in the instance of duplicates, incorrectly classified products, inaccurate entry of products into point-of-sale systems, or even simple human error at the point of purchase. Thus, there is a slight margin of error to consider. Brands listed on this page are ranked in the top twenty within the market and product category by total retail sales volume.

