.svg)


Where to Buy
Hecate Gardens is stocked at 24 licensed dispensaries across Oregon, with the deepest coverage in Portland, Beaverton, Coos Bay, Medford, and Oregon City. Search by ZIP code or city below to find the closest one.
Market Insights Snapshot
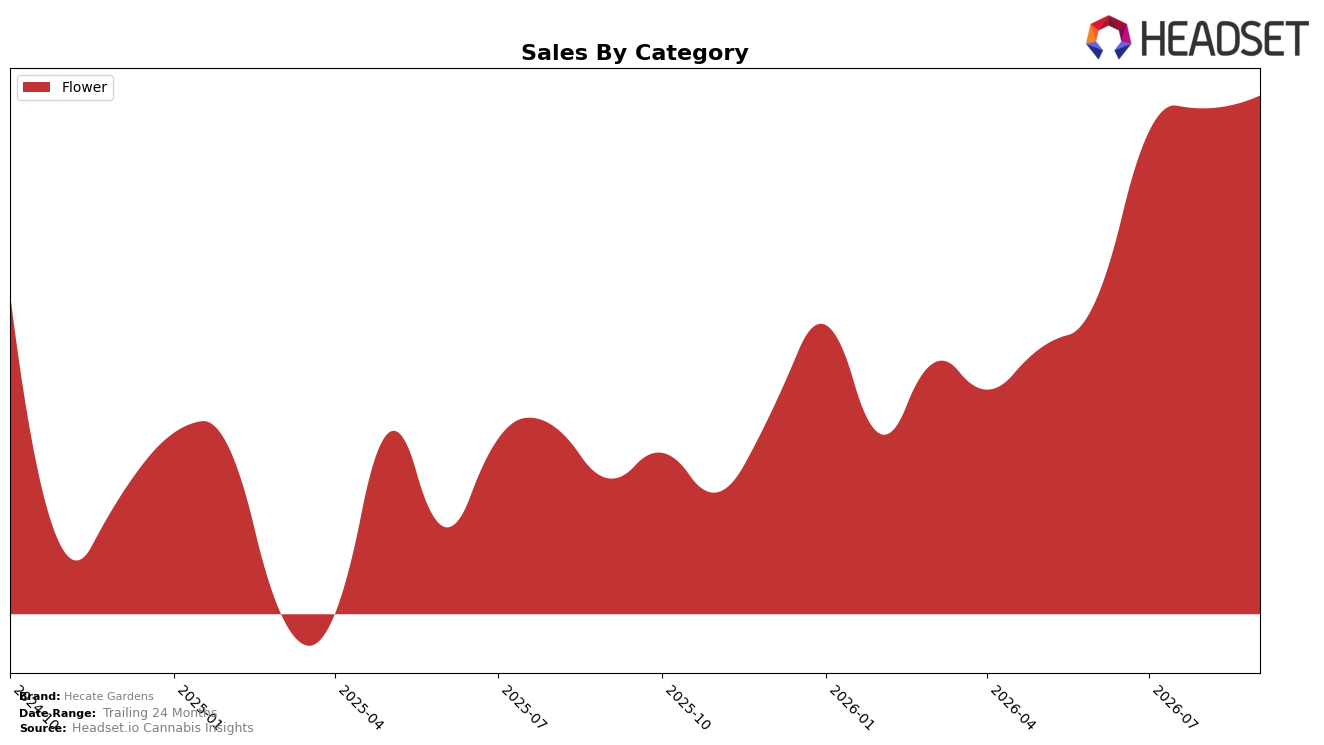
In September 2026, Hecate Gardens concentrated 100.0% of sales in Flower, with year-over-year growth of 187.9% and month-over-month growth of 2.2%. Average price moved down 13.2% YoY to $4.54 while the brand held rank 10 within Flower in Oregon, indicating volume expansion outpaced price compression. The pattern implies the brand is winning on throughput within a single-category focus, using lower unit pricing to fuel share within Flower without diversifying into other categories.
With all volume in Flower and a rank of 10 in Oregon, the 187.9% YoY surge alongside only 2.2% MoM suggests gains are lapping a small prior base while near-term momentum is stabilizing. The 13.2% YoY price decline against 100.0% category concentration points to a price-led positioning strategy that prioritizes unit velocity over premiumization. Taken together, Hecate Gardens is trading margin for scale in Flower, implying future headroom relies on either trading up price without losing rank or adding a second category to smooth the now single-threaded growth path.
Competitive Landscape
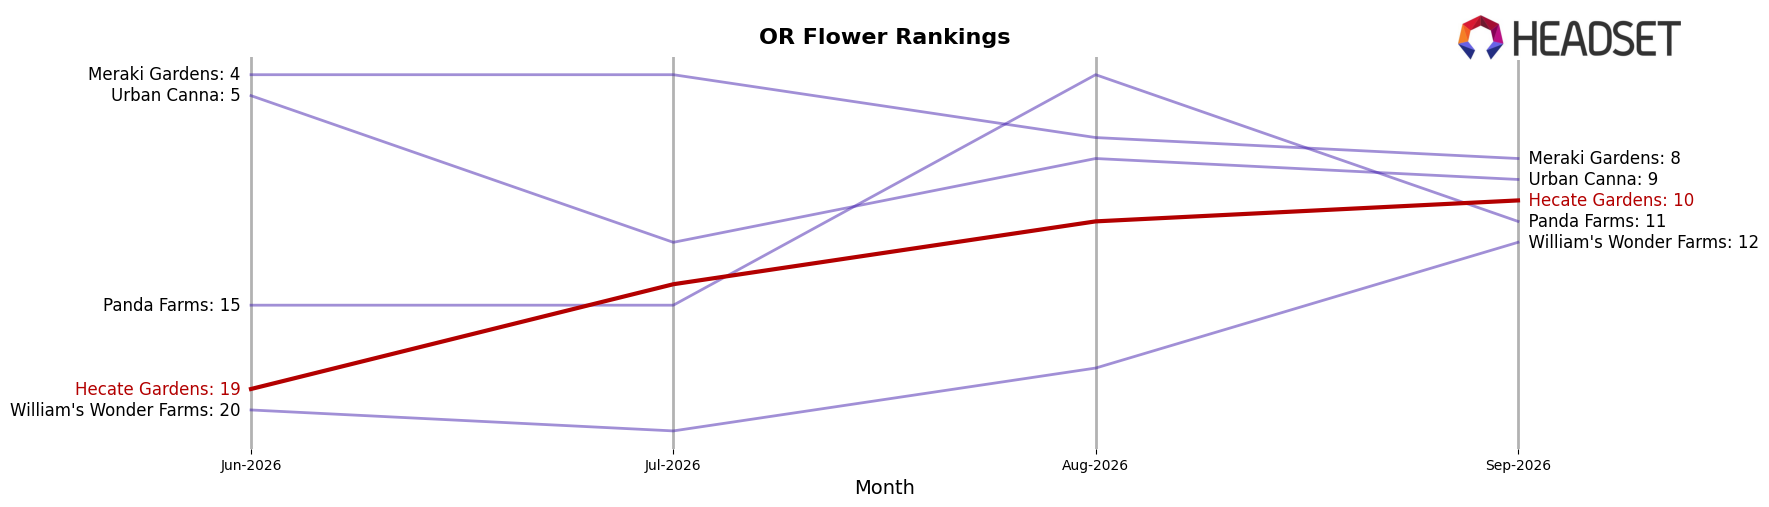
Hecate Gardens is ranked #10 in OR Flower in September 2026, up 23 positions year over year from #33, and up 9 positions since June 2026 when it sat at #19; this new peak rank of #10 in September 2026 coincides with competitors moving in divergent directions, as Oregrown climbed from #16 to #3 alongside a 169.7% year-over-year sales gain while PRUF Cultivar / PRŪF Cultivar slipped from #1 to #5 with a 49.3% year-over-year sales decline, and Grown Rogue advanced from #3 to #1 with a 63.8% increase; the mix of upward mobility among top players and contraction among prior leaders implies Hecate Gardens’ rise to #10 is timing with a reshuffle where sustaining share gains will require converting this quarter-to-quarter momentum into durable positioning against ascendant brands.
Notable Products
Island Foot (Bulk) posted the standout move in September 2026 with +70.8% month over month to rank 1, while Violet Funk (1g) also surged +60.8% to rank 5, together signaling that upsized gains clustered at the top and mid-top of the chart. In contrast, Marshmellow OG (1g) fell -16.9% into rank 2 and Oregon Lime Diesel (1g) dropped -25.4% to rank 4, indicating that momentum rotated away from certain 1g SKUs even as the leading bulk format expanded. Eight of the top ten are Flower SKUs in 1g format, but the presence of two Bulk items including the category leader and a single raw dollar anchor at $39,760 for Island Foot (Bulk) points to a tilt toward higher-volume pack sizes. The mix implies Hecate Gardens is shifting shelf energy toward bulk-driven velocity while selectively pruning underperforming 1g offerings to sustain rank concentration at the top.
Top Selling Cannabis Brands






Data for this report comes from real-time sales reporting by participating cannabis retailers via their point-of-sale systems, which are linked up with Headset’s business intelligence software. Headset’s data is very reliable, as it comes digitally direct from our partner retailers. However, the potential does exist for misreporting in the instance of duplicates, incorrectly classified products, inaccurate entry of products into point-of-sale systems, or even simple human error at the point of purchase. Thus, there is a slight margin of error to consider. Brands listed on this page are ranked in the top twenty within the market and product category by total retail sales volume.

