.svg)

Sep-2026
Sales
Trend
6-Month
Product Count
SKUs
Avg Price
YoY Sales Change
YoY Price Change


Market Insights Snapshot
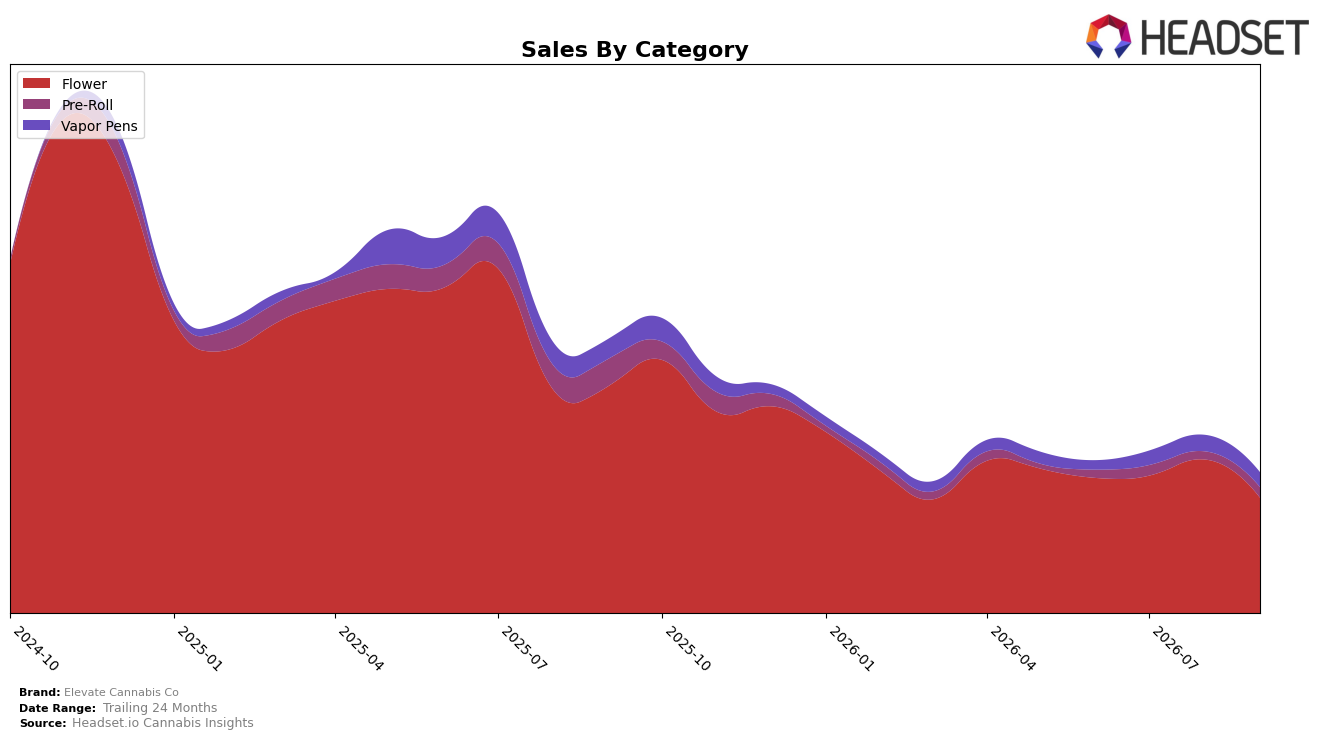
Elevate Cannabis Co concentrated 82.38% of September 2026 sales in Flower, with Vapor Pens at 10.35% and Pre-Roll at 7.28%; within this mix, Flower fell 49.18% year over year and 24.91% month over month while Vapor Pens declined 26.08% YoY and 9.84% MoM. Counter to those drops, Pre-Roll grew 32.05% MoM despite a 62.08% YoY decline, and the brand’s average price rose 2.55% YoY alongside a Flower average price of $23.10; the pattern implies overexposure to Flower is amplifying overall declines even as tactical Pre-Roll recovery offers a smaller, but faster-moving, offset.
With Flower ranked 42 in Missouri and controlling more than four-fifths of mix, a 24.91% MoM contraction in its core category exerts more drag than the 32.05% MoM lift in Pre-Roll can counter, especially as Vapor Pens also contracted 9.84% MoM. The combination of a 49.18% YoY Flower decline and a 26.08% YoY Vapor Pens decline, against a modest 2.55% YoY average price increase, implies positioning that leans on a weakening primary category and limits share capture, suggesting a need to rebalance toward Pre-Roll’s month-level momentum while insulating against further Flower-driven rank pressure.
Competitive Landscape
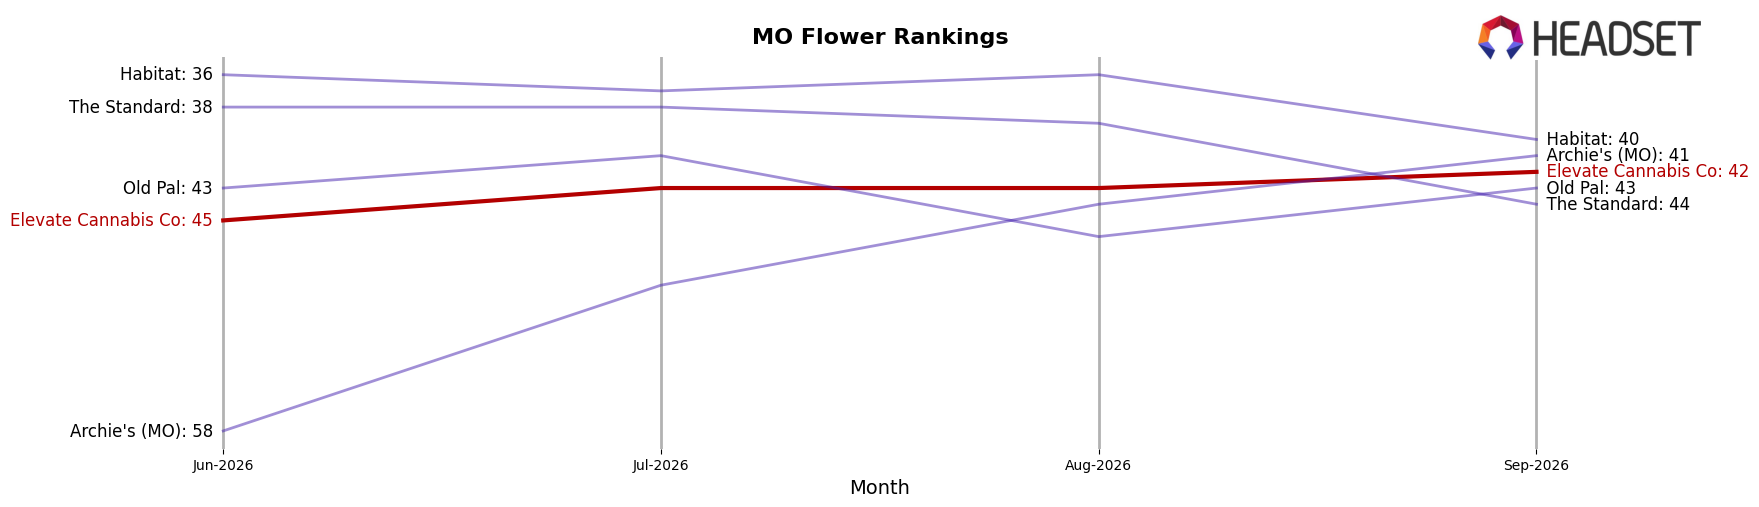
Elevate Cannabis Co sits at rank #42 in MO Flower for September 2026, down 7 positions year over year from #35, while improving 3 spots versus the three-month mark at #45; against its historical context, the brand is 22 positions below its peak of #20 set in November 2024 and trails the category leaders where Flora Farms held steady at #1 YoY and Amaze Cannabis climbed from #6 to #2 with roughly 19.8% YoY sales growth. This divergence—Elevate Cannabis Co sliding 7 ranks YoY while a top peer advanced 4 ranks YoY—implies the brand’s current trajectory is one of relative share loss unless it reclaims distribution or pricing levers to reverse the rank delta.
Notable Products
Cake Crasher Pre-Roll (1g) posted the standout movement in September 2026 with a +271.0% month-over-month surge into rank 2, while Headband Cookies (3.5g) fell -40.4% yet remained at rank 1. Flower concentration persisted with six of the top ten SKUs in the category, including declines of -30.8% for Hell's OG (3.5g) at rank 3 and a -4.9% dip for Grapefruit Durban (3.5g) at rank 5. This pattern implies Elevate Cannabis Co is leaning into Pre-Rolls for incremental velocity while Flower scale anchors share despite sharper volatility at the top.
Headband Cookies Pre-Roll (1g) slid -44.0% to rank 9 even as the similarly named Flower SKU held the top rank, and White Poison (3.5g) in Flower grew +11.6% at rank 4 against broader category softness. With Pre-Rolls split between a +271.0% gainer at rank 2 and a -44.0% decliner at rank 9, the format’s performance is polarized around a single hero. This suggests a portfolio pivot toward a few high-velocity Pre-Rolls supported by a wide, if uneven, Flower bench to maintain shelf presence and price laddering.
Top Selling Cannabis Brands






Data for this report comes from real-time sales reporting by participating cannabis retailers via their point-of-sale systems, which are linked up with Headset’s business intelligence software. Headset’s data is very reliable, as it comes digitally direct from our partner retailers. However, the potential does exist for misreporting in the instance of duplicates, incorrectly classified products, inaccurate entry of products into point-of-sale systems, or even simple human error at the point of purchase. Thus, there is a slight margin of error to consider. Brands listed on this page are ranked in the top twenty within the market and product category by total retail sales volume.

