.svg)

Sep-2026
Sales
Trend
6-Month
Product Count
SKUs
Avg Price
YoY Sales Change
YoY Price Change


Where to Buy
Hi Guys is stocked at 54 licensed dispensaries across Washington and Oklahoma, 49 of them in Washington, with the deepest coverage in Everett, Spokane, Tacoma, Shelton, and Mount Vernon. Search by ZIP code or city below to find the closest one, or filter by product type if you are after a specific format.
Market Insights Snapshot
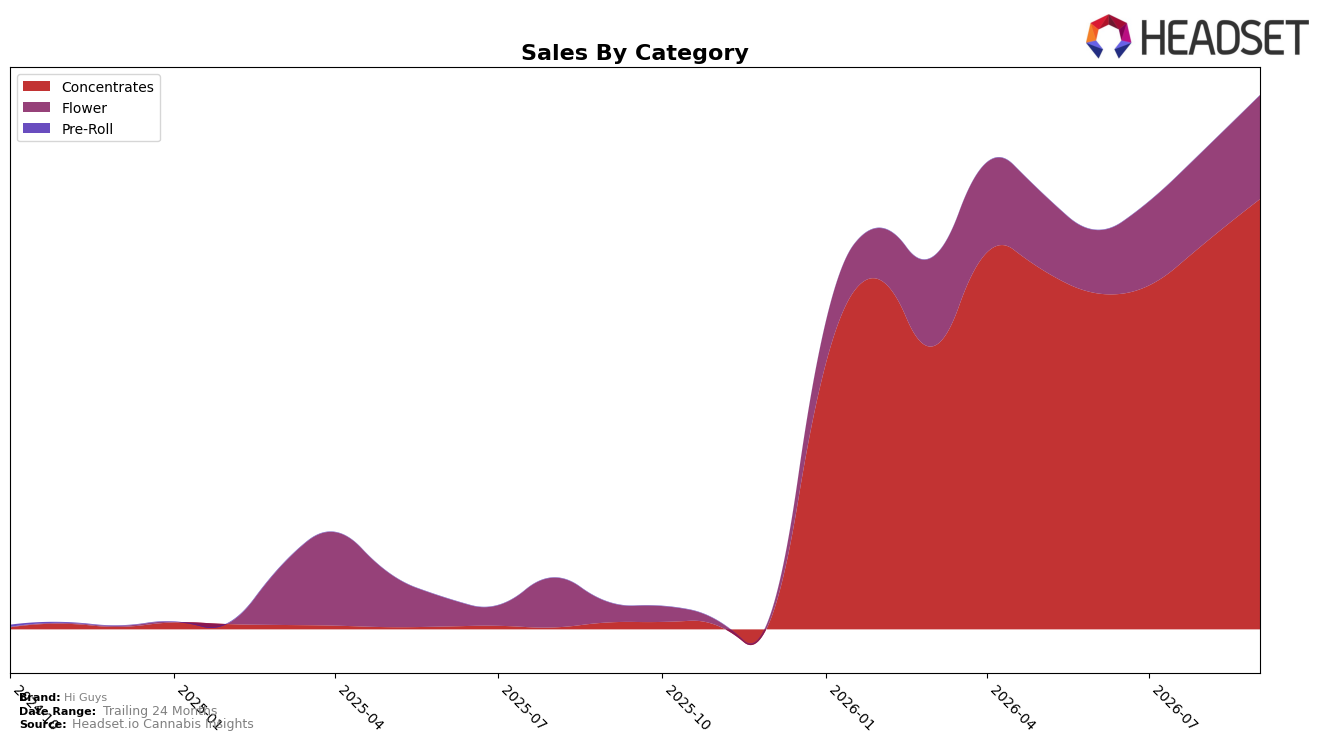
In September 2026, Hi Guys concentrated 80.61% of sales in Concentrates with month-over-month growth of 11.44% and year-over-year growth of 6519.07%, while Flower accounted for 19.39% of sales with month-over-month growth of 10.66% and year-over-year growth of 416.19%. The brand’s average price fell 55.03% year over year to $4.07, and Concentrates’ average price sat at $3.51 versus Flower at $12.32, indicating a deliberate push toward lower-priced volume. The brand ranked 17 in Concentrates in Washington, pairing rank stability with a rapid share tilt into Concentrates. The pattern implies Hi Guys is driving scale via high-velocity, low-price Concentrates while keeping Flower as a smaller, slower-growing complement.
The mix shift raises positioning implications: anchoring 80.61% in Concentrates with 11.44% MoM growth alongside a 55.03% YoY price drop suggests the brand is optimizing for throughput and penetration rather than premium margin, and the 19.39% Flower share with 10.66% MoM growth provides limited diversification. Holding rank 17 in Washington Concentrates amid 6519.07% YoY growth points to headroom to climb ranks if price-led acquisition converts to repeat, yet the $3.51 Concentrates price versus $12.32 Flower price signals a risk of price anchoring that could cap trade-up. Net effect: the current structure positions Hi Guys as a value-forward Concentrates player using price elasticity to gain share, with Flower serving as a hedge but not a primary driver.
Competitive Landscape
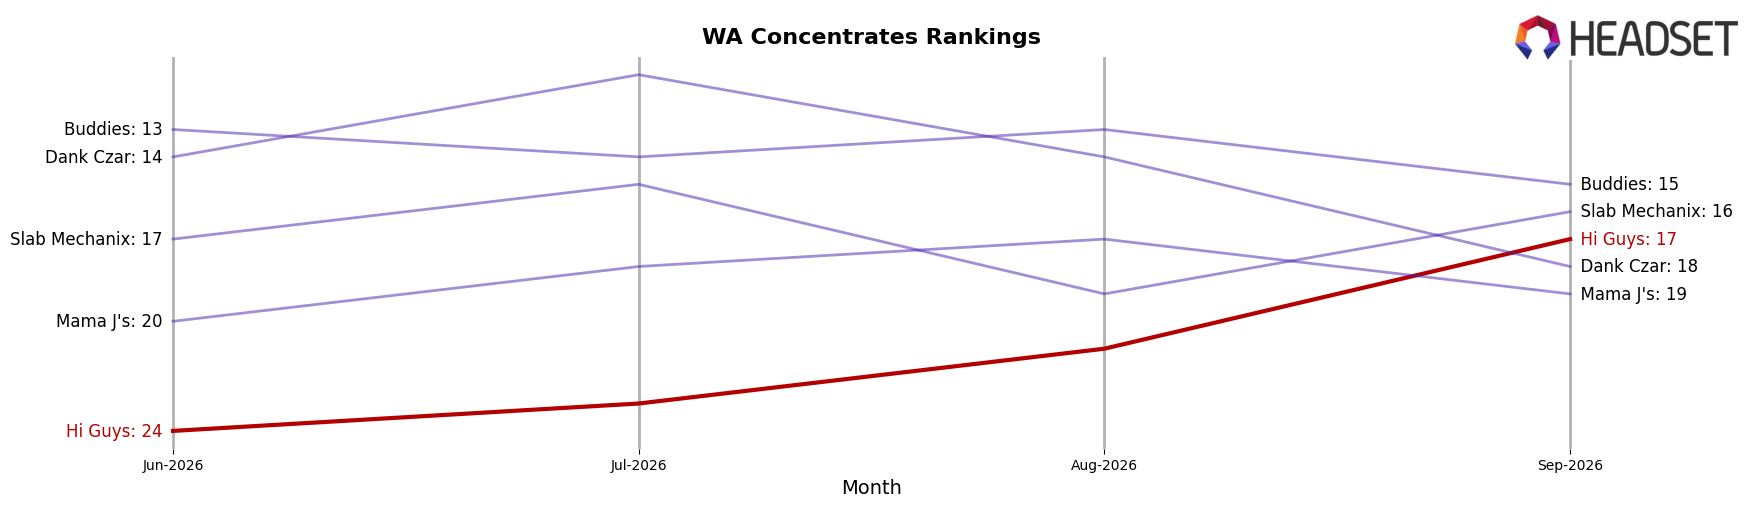
Hi Guys sits at rank #17 in WA Concentrates in September 2026, a climb of 248 positions year over year from #265, and an advance of 7 spots from #24 in June 2026; this coincides with reaching a new peak rank of #17 in September 2026 and moving ahead of lower-tier peers while still trailing leaders. In contrast, Ooowee held steady at #1 year over year while posting a -7.8% sales change, and Constellation Cannabis rose from #11 to #5 with an 88.8% YoY sales increase, indicating that Hi Guys’ rapid rank rebound is tied more to recent share capture than category-wide contraction and implies runway for further mid-tier gains if momentum from June 2026 to September 2026 persists.
Notable Products
Wedding Cake BHO Wax (1g) posted the standout move in September 2026 with a +59.8% month-over-month surge to $8,366 while holding rank 1, as Mango Sunset Wax (1g) slid -10.6% at rank 3 and White Runtz Wax (1g) fell -20.8% at rank 10. With Orangutan Titties Wax (1g) down -36.2% at rank 7 and GMO Cookies BHO Wax (1g) off -17.2% at rank 9, four of the top ten are declines within the same Concentrates category, yet ranks 1–4 are all Concentrates. The pattern points to a consolidation around a few winners at the top of Concentrates while lower-ranked SKUs shed velocity, implying Hi Guys is tilting assortment and demand toward flagship wax variants.
Top Selling Cannabis Brands






Data for this report comes from real-time sales reporting by participating cannabis retailers via their point-of-sale systems, which are linked up with Headset’s business intelligence software. Headset’s data is very reliable, as it comes digitally direct from our partner retailers. However, the potential does exist for misreporting in the instance of duplicates, incorrectly classified products, inaccurate entry of products into point-of-sale systems, or even simple human error at the point of purchase. Thus, there is a slight margin of error to consider. Brands listed on this page are ranked in the top twenty within the market and product category by total retail sales volume.

