.svg)

Aug-2026
Sales
Trend
6-Month
Product Count
SKUs
Avg Price
YoY Sales Change
YoY Price Change


Market Insights Snapshot
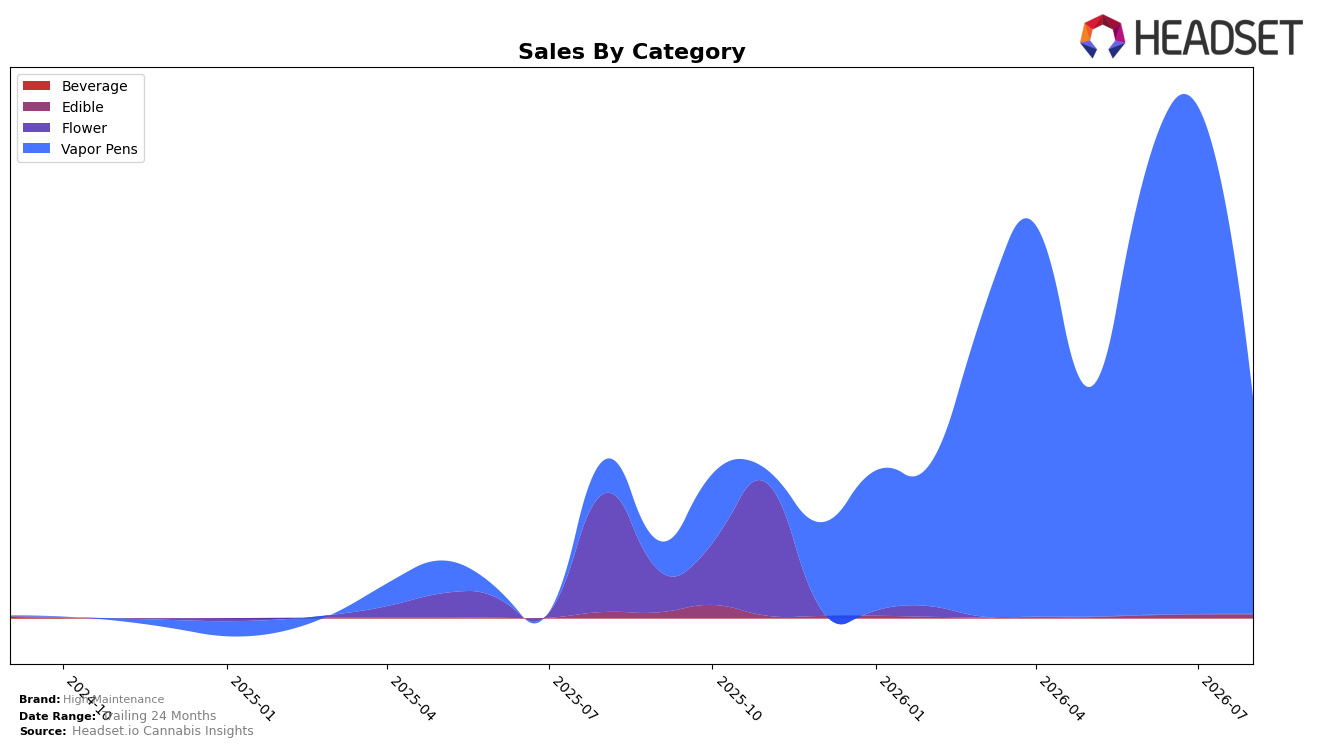
In August 2026, Vapor Pens accounted for 98.45% share with year-over-year growth of 552.53% but a month-over-month decline of 57.47%, while Edible held 1.55% share with a year-over-year decrease of 41.34% and a month-over-month increase of 4.86%. Against a brand-level year-over-year sales change of 39.84% and an average price up 69.60% to $30.01, the category mix indicates extreme concentration in Vapor Pens alongside a small but stabilizing Edible contribution. The combined signal of a 552.53% Vapor Pens surge and a 57.47% monthly pullback, paired with Edible’s 4.86% monthly uptick amid a 41.34% annual decline, implies demand is highly volatile within the core segment and that diversification is emerging from a very low base.
With a 98.45% reliance on Vapor Pens and a rank of 48 in Vapor Pens in British Columbia, High Maintenance is positioned as a niche-heavy player whose scale depends on a single category where monthly swings of 57.47% can dictate trajectory. The 69.60% year-over-year rise in average price alongside a 552.53% year-over-year volume lift in Vapor Pens suggests the brand is stretching price while still converting, but the 41.34% annual decline in Edible and its 1.55% share cap the insulation against Vape volatility. This pattern implies the brand’s competitive posture is defined by depth in one category rather than breadth, making the August 2026 recovery path contingent on stabilizing Vapor Pens while nurturing Edible’s 4.86% monthly momentum to reduce exposure.
Competitive Landscape
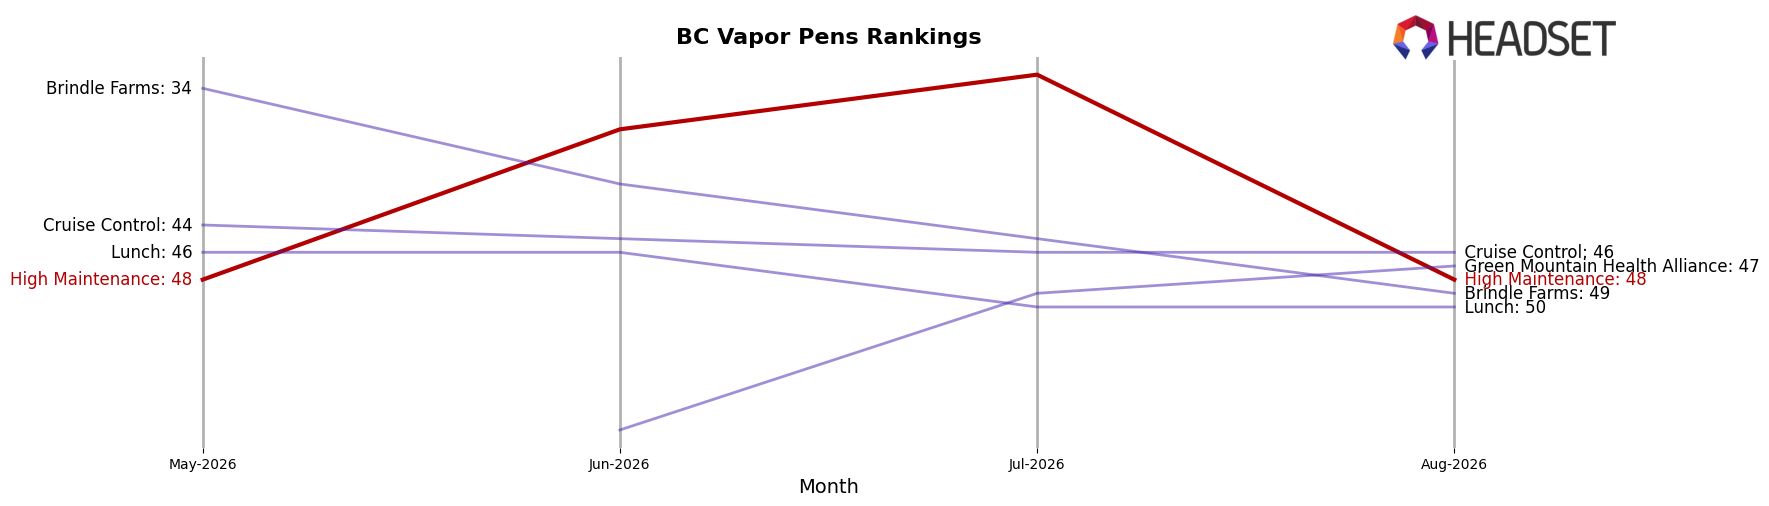
High Maintenance sits at rank 48 in BC Vapor Pens in August 2026, improving 25 positions from rank 73 year over year, yet holding flat versus May–July with a repeat rank of 48 while coming off a peak rank of 33 in July 2026. In contrast, Spinach climbed from rank 3 to rank 1 with 242.2% YoY sales growth, and BoxHot slipped from rank 1 to rank 2 despite 15.4% YoY growth, signaling that High Maintenance’s mid-pack recovery is occurring alongside accelerating top-tier gains that compress room for ascent; the pattern implies a stabilization phase where holding the July 2026 peak momentum will require share capture against leaders advancing 1–2 ranks while High Maintenance advanced 25 ranks YoY but did not improve month over month.
Notable Products
OG Honey Oil Distillate Disposable (1g) posted the steepest decline at -93.97% month over month, falling to rank 5, while Watermelon Honey Oil Distillate Disposable (1g) also slid -81.52% at rank 3. In contrast, Crunchy Raspberry Chews (10mg) surged +143.72% to rank 2, and Pineapple Honey Oil Distillate Disposable (1g) dropped -49.20% but still held rank 1 with $44,972 in August 2026. Three of the top five are Vapor Pens, yet two of those pens registered declines greater than -80% or near -50%, indicating category concentration with deteriorating velocity offset by a single Edible mover.
Top Selling Cannabis Brands






Data for this report comes from real-time sales reporting by participating cannabis retailers via their point-of-sale systems, which are linked up with Headset’s business intelligence software. Headset’s data is very reliable, as it comes digitally direct from our partner retailers. However, the potential does exist for misreporting in the instance of duplicates, incorrectly classified products, inaccurate entry of products into point-of-sale systems, or even simple human error at the point of purchase. Thus, there is a slight margin of error to consider. Brands listed on this page are ranked in the top twenty within the market and product category by total retail sales volume.

