Jun-2026
Sales
Trend
6-Month
Product Count
SKUs
Avg Price
YoY Sales Change
YoY Price Change
Market Insights Snapshot
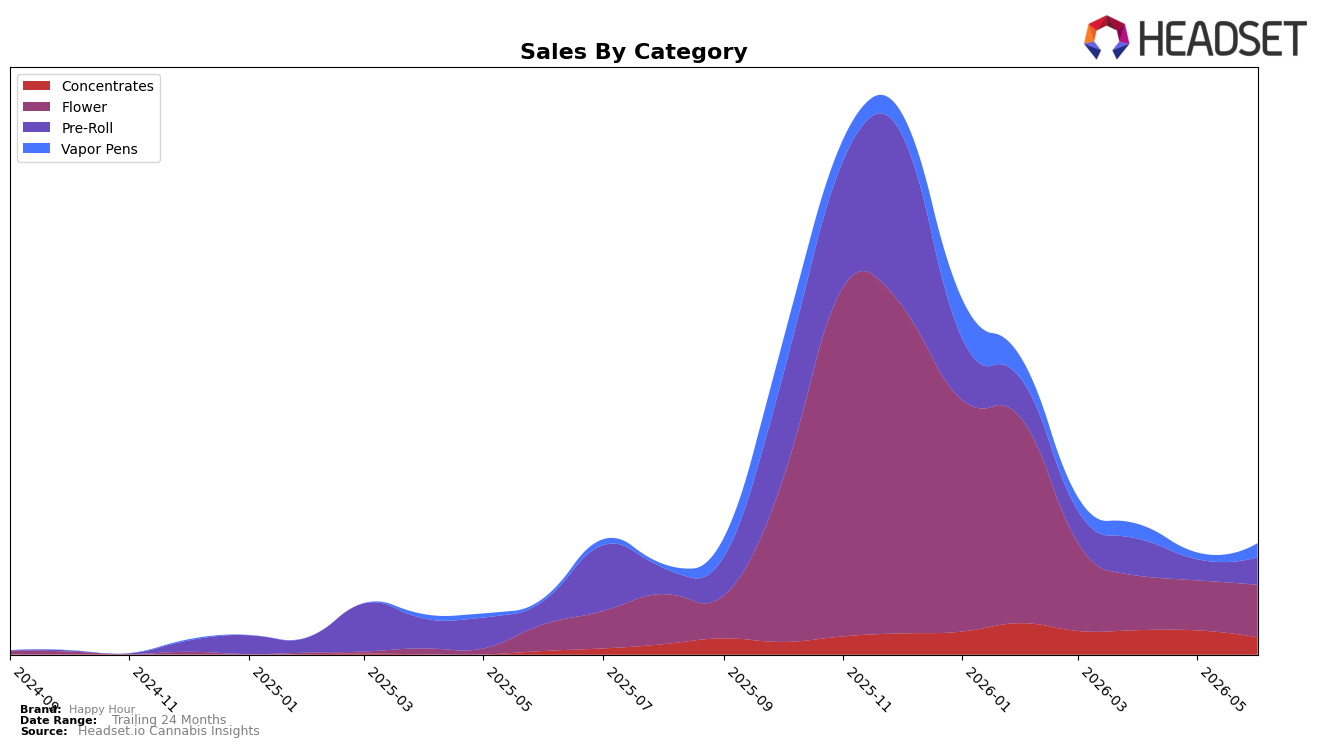
Happy Hour’s category mix in June 2026 tilted toward Flower at 47.31% share, with Flower growing 97.99% year over year and 5.02% month over month, while Pre-Roll held 24.71% share with 16.37% YoY and 30.90% MoM growth. Vapor Pens expanded to 12.45% share with a 474.51% YoY surge and 112.97% MoM jump, whereas Concentrates sat at 15.54% share with 395.67% YoY growth but a 28.82% MoM decline. With brandwide sales up 98.31% YoY and average price up 34.57% YoY, this mix signals a pivot toward higher-velocity inhalables, as Vapor Pens’ triple-digit MoM rise contrasts with Concentrates’ double-digit MoM pullback, implying reallocation of demand within inhalables.
Positioning-wise, the heavy Flower base and the 112.97% MoM climb in Vapor Pens — alongside a 5.02% MoM Flower gain — indicate diversified inhalable demand that can buffer category cyclicality, while the 28.82% MoM drop in Concentrates introduces volatility risk concentrated in a mid-sized share segment at 15.54%. In British Columbia Flower, a rank of 56 coupled with a 47.31% internal mix weight suggests headroom for distribution and SKU depth, and the 30.90% MoM lift in Pre-Roll at 24.71% share provides a scalable bridge between value and trade-up paths as average price rose 34.57% YoY, implying pricing power without eroding unit momentum.
Competitive Landscape
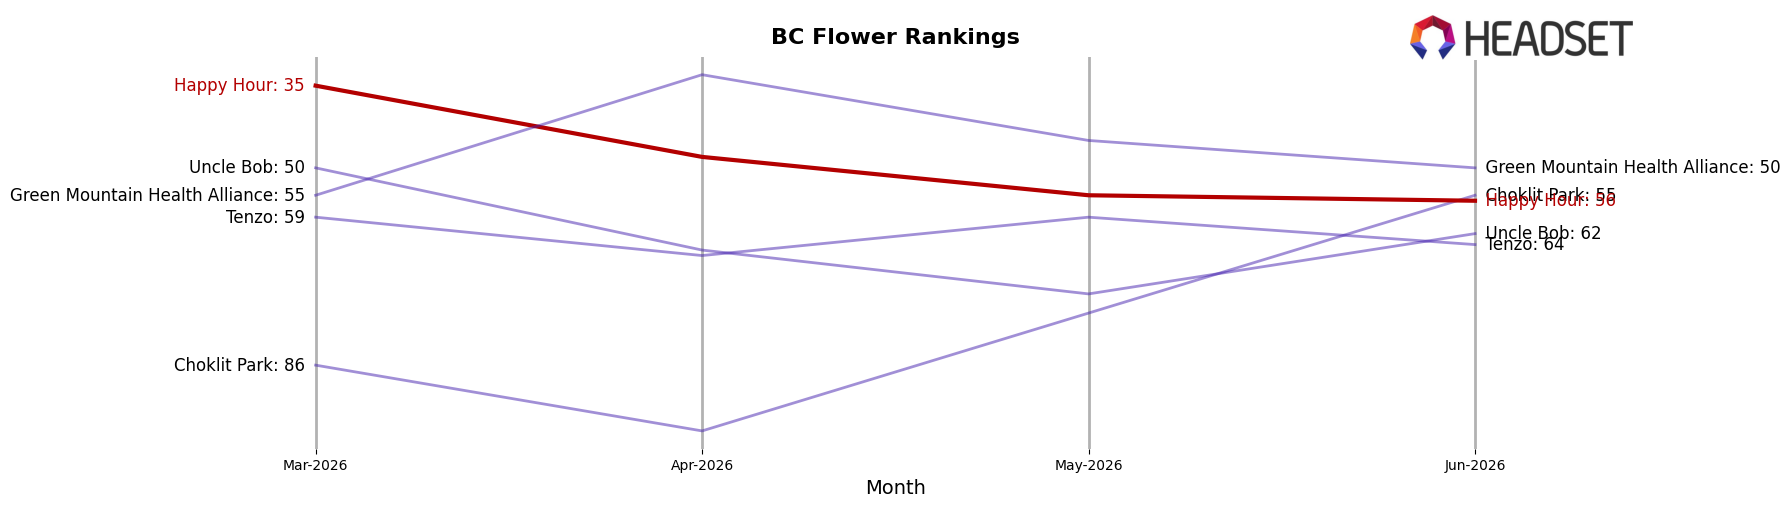
Happy Hour ranks #56 in BC Flower in June 2026, a 20-spot improvement from #76 year over year, but down 21 ranks from #35 in March 2026; against the broader tier, Good Supply climbed from #6 to #1 while Spinach moved from #8 to #3, indicating competitors are accelerating as Happy Hour retreats from its October 2025 peak of #12. With peers posting divergent sales trends—Spinach up 84.9% YoY at rank #3 and The Original Fraser Valley Weed Co. sliding to #4 with a -24.4% YoY change—the directional gap suggests Happy Hour’s recent rank loss of 21 places quarter-over-quarter outweighs its 20-place YoY gain, implying the brand’s trajectory is toward mid-pack volatility rather than sustained recovery.
Notable Products
Nightmare Kush Mints (7g) posted the headline move in June 2026 with a +254.7% month-over-month surge to rank 2, while Hybrid THCA Topper (1g) fell -25.1% at rank 3 and Indica Pre-Roll 10-Pack (5g) slid -44.6% at rank 10. Pure Cake Skunk Pre-Roll 2-Pack (2g) held rank 1 despite no reported month-over-month rate, as Flower captured two of the top five spots with Nightmare Kush Mints (7g) at rank 2 and Sour Candy (1g) up +123.5% at rank 5. With three Pre-Roll SKUs still in the top ten but one declining -44.6% and another dropping -14.0% at rank 6, the mix tilts toward scaling Flower while rationalizing underperforming Pre-Roll formats, pointing to a pivot toward higher-velocity Flower offerings.
Top Selling Cannabis Brands
Data for this report comes from real-time sales reporting by participating cannabis retailers via their point-of-sale systems, which are linked up with Headset’s business intelligence software. Headset’s data is very reliable, as it comes digitally direct from our partner retailers. However, the potential does exist for misreporting in the instance of duplicates, incorrectly classified products, inaccurate entry of products into point-of-sale systems, or even simple human error at the point of purchase. Thus, there is a slight margin of error to consider. Brands listed on this page are ranked in the top twenty within the market and product category by total retail sales volume.

