May-2026
Sales
Trend
6-Month
Product Count
SKUs
Avg Price
YoY Sales Change
YoY Price Change
Market Insights Snapshot
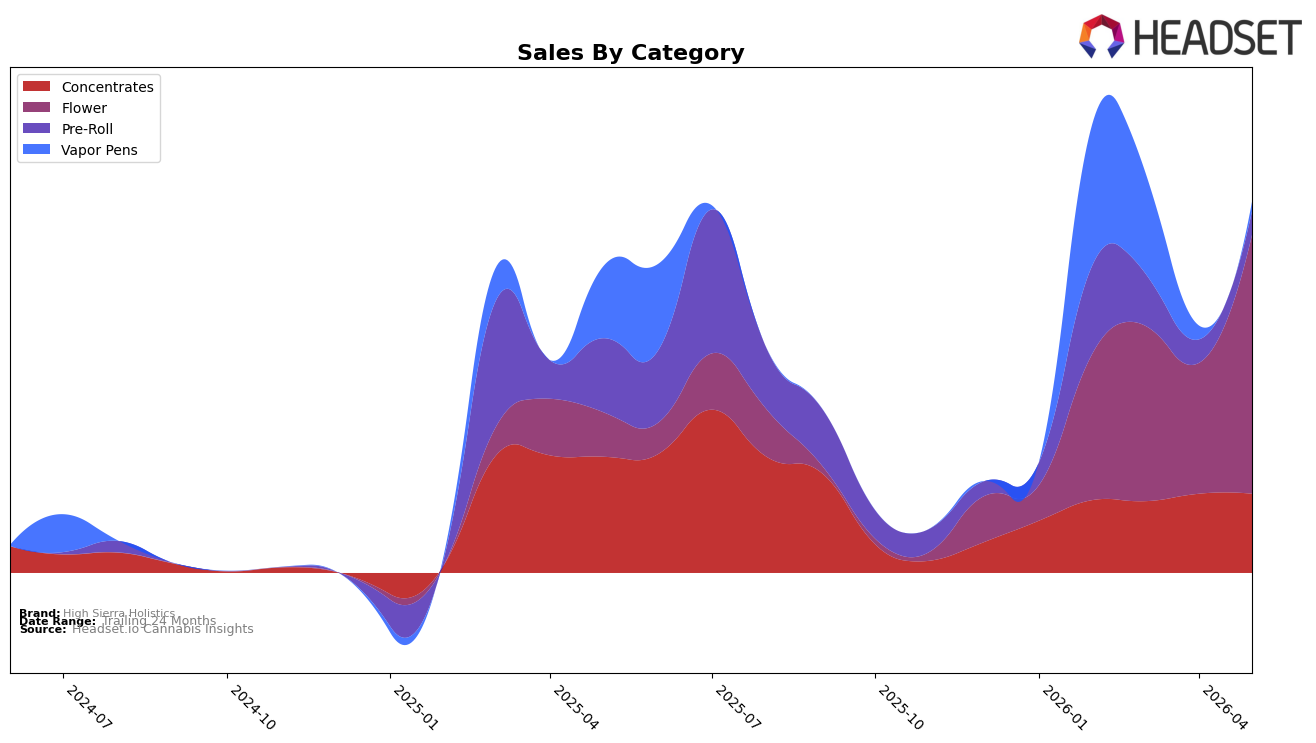
In May 2026, High Sierra Holistics concentrated 69.82% of sales in Flower, up 98.14% month over month and 484.76% year over year, while its Flower rank sat at 52 in Nevada. Concentrates held 21.33% share with a near-flat 0.02% MoM change and a 31.91% YoY decline, as Pre-Roll slipped to 6.32% share with a 0.32% MoM uptick but a 68.31% YoY drop, and Vapor Pens fell to 2.53% share with a 32.39% MoM decline and an 86.96% YoY decrease; this mix implies a pivot away from inhalable formats outside Flower and a deepening reliance on a single category. With the average price down 19.42% YoY to $23.90 alongside a 21.04% YoY brand sales lift, the pattern points to volume-led gains concentrated in Flower rather than broad-based category growth.
The shift toward Flower at 69.82% share alongside a 98.14% MoM surge and a 484.76% YoY rise suggests positioning as a value-forward Flower specialist rather than a balanced portfolio brand, reinforced by the 19.42% YoY price compression. The flat 0.02% MoM in Concentrates against a 31.91% YoY drop, plus Pre-Roll’s 0.32% MoM but 68.31% YoY decline and Vapor Pens’ 32.39% MoM and 86.96% YoY contractions, indicate limited traction in adjacent formats, implying that maintaining or improving the 52 rank in Nevada Flower will be more impactful to total sales than diversifying until pricing and velocity in non-Flower stabilize.
Competitive Landscape
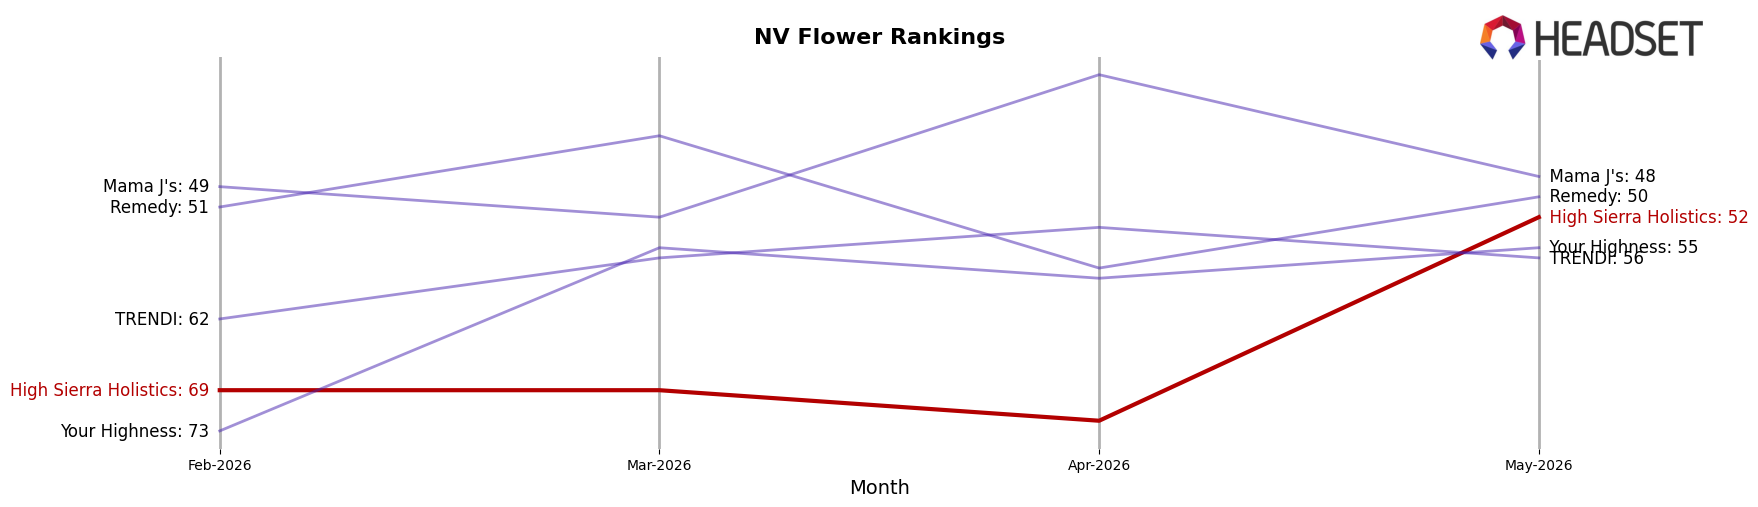
High Sierra Holistics sits at rank #52 in NV Flower in May 2026, improving 45 positions from #97 year over year, and rising 17 spots from #69 since February 2026; this coincides with reaching a peak rank of #52 in May 2026 and moving ahead of the category median by gaining rank share while top-5 congestion stayed tight. Against that backdrop, STIIIZY held #1 with an 8.45% year-over-year sales lift, while RYTHM slipped from #3 to #2 with a 14.37% sales decline, and Redwood vaulted from #54 to #5 on a 916.84% sales increase, indicating the competitive ladder is fluid at both the top and the mid-tier. The pattern—mid-pack ascent during a bifurcating field where leaders either entrench or leap—implies High Sierra Holistics’ trajectory is one of opportunistic share capture if it can convert recent rank momentum into sustained velocity.
Notable Products
Golden Sands (3.5g) posted a 186.4% month-over-month jump to rank 1 in May 2026, while High Sierra Kush (3.5g) fell 32.5% to rank 4, marking opposing trajectories at the top of the list. Flower SKUs occupy six of the top ten, and two Pre-Roll SKUs sit at ranks 7 and 9, indicating concentration in inhalables even as Blueberry Muffin Live Resin (1g) rose 45.5% at rank 10. With Flower capturing ranks 1 through 6 except for two Pre-Rolls, the mix points to a pivot toward scaled Flower velocity led by one breakout SKU rather than balanced category development.
Top Selling Cannabis Brands
Data for this report comes from real-time sales reporting by participating cannabis retailers via their point-of-sale systems, which are linked up with Headset’s business intelligence software. Headset’s data is very reliable, as it comes digitally direct from our partner retailers. However, the potential does exist for misreporting in the instance of duplicates, incorrectly classified products, inaccurate entry of products into point-of-sale systems, or even simple human error at the point of purchase. Thus, there is a slight margin of error to consider. Brands listed on this page are ranked in the top twenty within the market and product category by total retail sales volume.

