.svg)

Sep-2026
Sales
Trend
6-Month
Product Count
SKUs
Avg Price
YoY Sales Change
YoY Price Change


Market Insights Snapshot
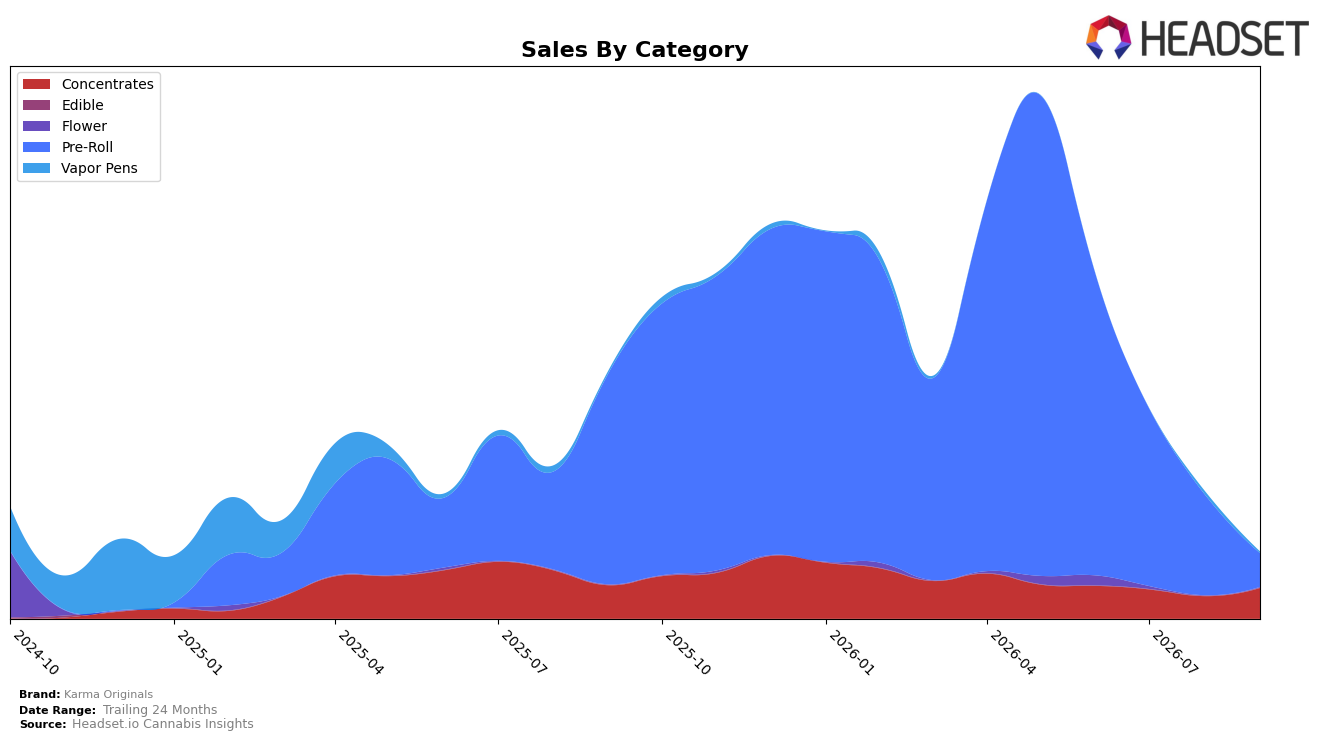
Karma Originals’ mix in September 2026 is concentrated in Pre-Roll at 51.10% share and Concentrates at 46.68% share, with Vapor Pens at 1.90% and Flower at 0.32%. Pre-Roll contracted sharply year over year at -84.17% and month over month at -66.88%, while Concentrates moved the other way with -8.38% year-over-year and +36.57% month-over-month; Vapor Pens also declined at -47.67% year over year and -59.72% month over month. Coupled with a 7.77% increase in average price and a brand-level year-over-year sales change of -73.50%, the pattern implies a pivot away from volume-heavy Pre-Rolls toward a relatively more stable Concentrates base, likely concentrating revenue in fewer SKUs and reducing breadth.
This shift aligns with a current rank of 31 in Nevada Concentrates and a top-category designation in Concentrates, while Pre-Roll’s steep month-over-month drop of -66.88% contrasts with Concentrates’ +36.57% month-over-month gain. With Concentrates holding 46.68% of mix alongside a brand 24-month change of -14.48%, the near-term mix tilt suggests repositioning toward categories where rank can be defended at 31 and pricing power (+7.77% YoY) can be maintained. The implication is a tactical narrowing: emphasize Concentrates to mitigate Pre-Roll volatility, accept lower Vapor Pen exposure at 1.90% share, and focus on pricing and distribution steps that can convert month-over-month Concentrates momentum into steadier share while managing a -73.50% year-over-year drag.
Competitive Landscape
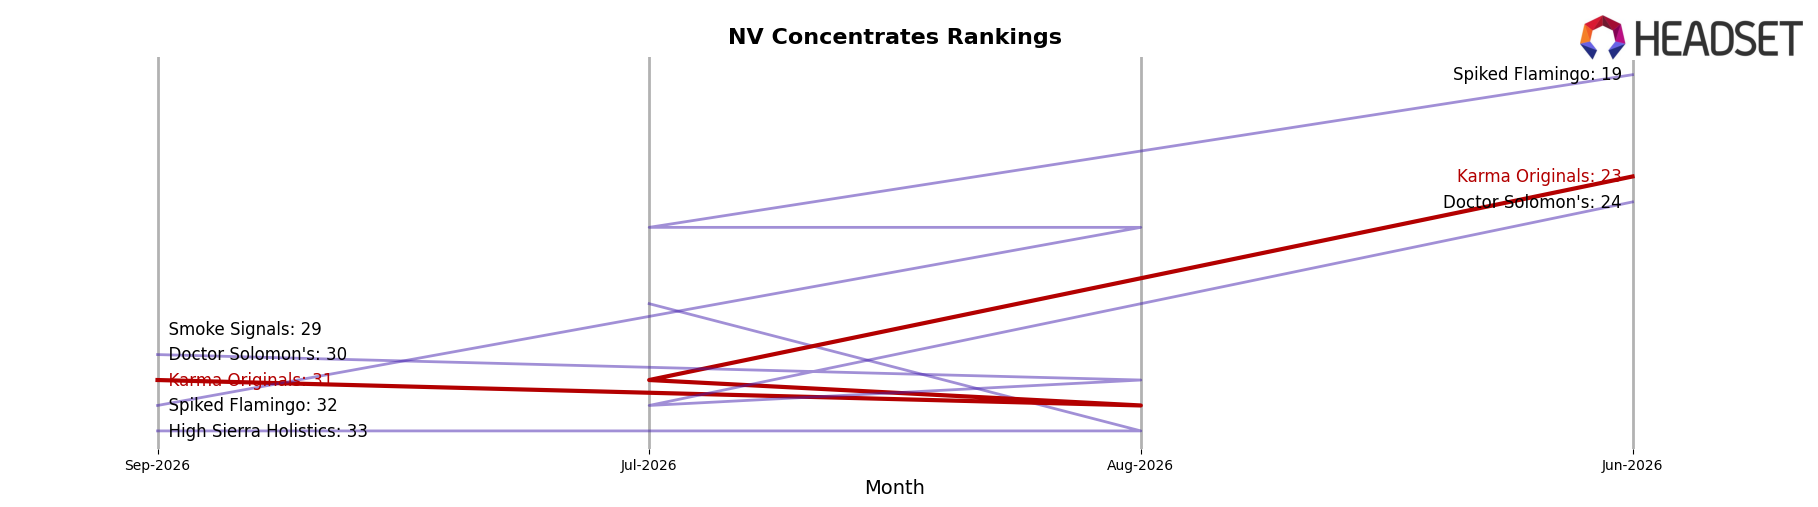
Karma Originals sits at rank #31 in NV Concentrates for September 2026, down 2 positions year over year from #29 and 8 positions below its June 2026 mark of #23, indicating a two-quarter slide despite having peaked at #19 in December 2025. In contrast, Medizin held #1 year over year and remains #1 in September 2026 even as its sales declined 34.8%, while City Trees climbed from #6 to #3 alongside a 16.7% sales increase; this divergence—stable or improving ranks at the top alongside mixed sales trends—implies Karma Originals is losing relative shelf position to competitors that either sustain share through rank stability or capture gains with double‑digit growth, signaling a need to arrest rank erosion before it hardens into lower baseline visibility.
Notable Products
Summer Sangria Infused Pre-Roll (1.2g) posted the steepest decline at -51.1% month over month and slid to rank 5, while CBG/CBN/THC 1:1:4 Calm RSO Syringe (1g) rose 46.7% MoM to hold rank 1 with $12,366 in September 2026 sales. The pre-roll lineup is concentrated, with eight of the top ten SKUs in Pre-Roll, yet only one of those shows a quantified MoM move, implying volatility is currently concentrated in a single flavor rather than the entire format. The juxtaposition of a rising Concentrates leader at rank 1 and a sharply falling pre-roll at rank 5 indicates mix shift risk toward higher-potency, function-forward formats and away from seasonal flavor extensions.
Top Selling Cannabis Brands






Data for this report comes from real-time sales reporting by participating cannabis retailers via their point-of-sale systems, which are linked up with Headset’s business intelligence software. Headset’s data is very reliable, as it comes digitally direct from our partner retailers. However, the potential does exist for misreporting in the instance of duplicates, incorrectly classified products, inaccurate entry of products into point-of-sale systems, or even simple human error at the point of purchase. Thus, there is a slight margin of error to consider. Brands listed on this page are ranked in the top twenty within the market and product category by total retail sales volume.

